Gold Price Prediction: Forecast, Trends, and Market Outlook

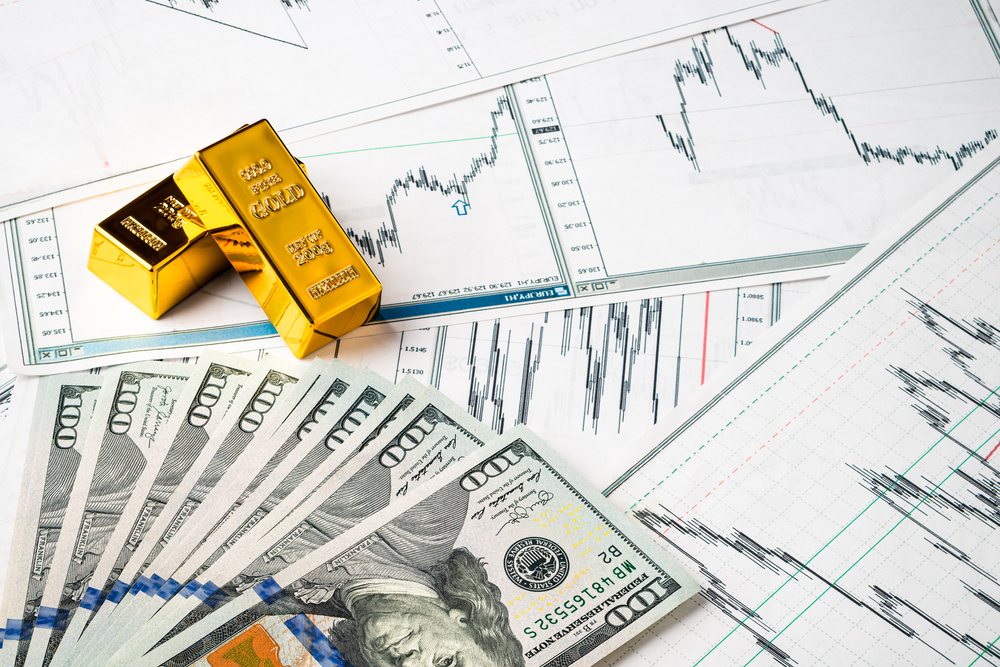
Gold has always held a unique position in global financial markets. For centuries, it has been viewed as a store of value, a hedge against uncertainty, and a symbol of wealth and stability. In modern markets, gold is also a highly traded financial asset, attracting traders, investors, and institutions from around the world. Because of this importance, gold price prediction has become a critical topic for anyone looking to understand market trends, manage risk, or identify trading and investment opportunities.

What is gold, and what affects its price?

Gold is a precious metal with both industrial and financial uses, but its primary role in modern markets is as an investment and reserve asset. Central banks hold gold as part of their reserves, investors buy it as a hedge, and traders speculate on its price movements. These diverse uses make gold price prediction a complex process influenced by multiple variables.

One of the most critical factors affecting gold prices is supply and demand. Gold supply is relatively limited because mining production grows slowly. On the demand side, investment demand often fluctuates based on economic conditions, inflation expectations, and market uncertainty. When demand rises faster than supply, prices tend to increase, influencing gold price prediction models.

Inflation is another key driver. Gold is often seen as a hedge against rising inflation, as its value tends to hold up when purchasing power declines. When inflation expectations rise, investors may shift capital into gold, strengthening the gold price prediction for higher levels.

Interest rates also play a significant role. Since gold does not generate interest or dividends, higher interest rates can reduce its attractiveness compared to yield-bearing assets. Lower or falling interest rates, on the other hand, often support higher gold prices.

Currency movements, especially the U.S. dollar, are closely linked to gold prices. Gold is typically priced in dollars, so a weaker dollar can make gold cheaper for international buyers, increasing demand. This relationship is a core component of gold price prediction and forex analysis.

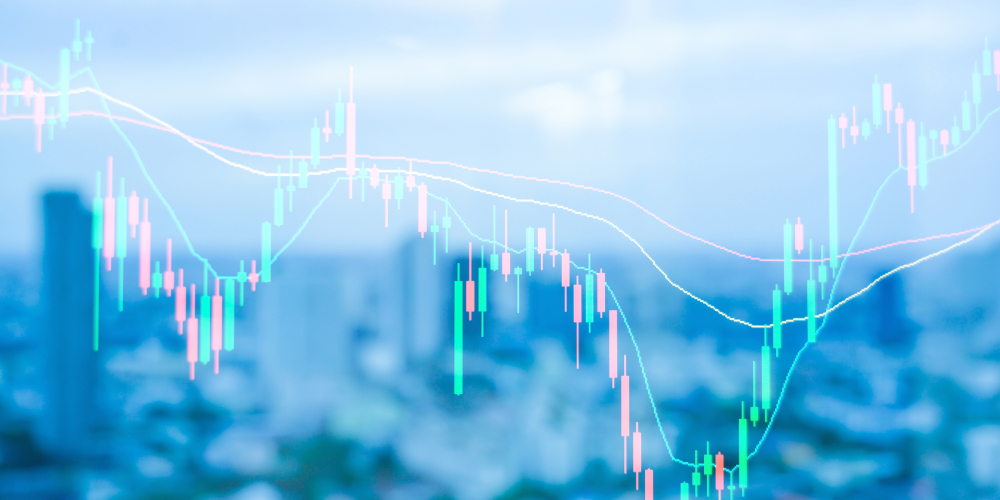
Gold Price Prediction Chart Analysis

Chart analysis is one of the most widely used methods in gold price prediction. By studying historical price data, traders attempt to identify patterns and levels that may influence future price movements.

Reading gold price prediction charts

Gold price prediction charts display price movements over time, using different timeframes such as minutes, hours, days, or weeks. Shorter timeframes are useful for day traders, while longer timeframes are more relevant for investors. Understanding how to read these charts is essential for interpreting trends and potential reversals.

Candlestick charts are particularly popular because they show opening, closing, high, and low prices within a specific period. The shape and size of candlesticks can provide insight into market sentiment and momentum, which are key elements of gold price prediction latest analysis.

Key support and resistance levels

Support and resistance levels represent price zones where buying or selling pressure has historically been intense. Support is an area where prices tend to stop falling, while resistance is where prices often struggle to rise further. Identifying these levels helps traders anticipate potential turning points in gold price prediction.

When gold breaks above a resistance level, it may signal bullish momentum. Conversely, a break below support can indicate bearish pressure. These levels are often used to set entry points, stop-loss orders, and profit targets.

Trendlines, patterns, and momentum indicators

Trendlines connect a series of higher lows or lower highs, helping traders visualize the overall direction of the market. Patterns such as triangles, channels, and flags often appear on gold price charts and can signal continuation or reversal scenarios.

Momentum indicators like RSI and MACD complement chart patterns by measuring the strength of price movements. Together, these tools form a technical foundation for gold price prediction chart analysis.

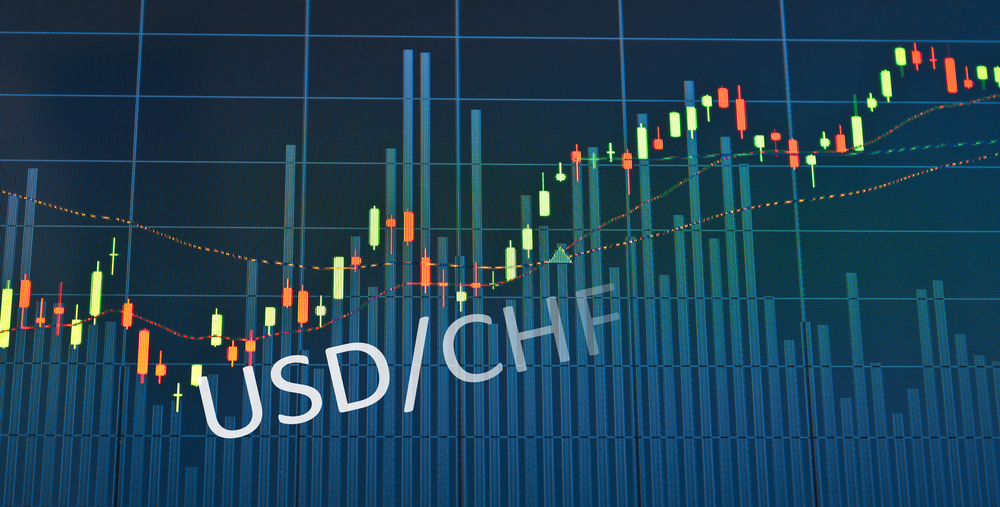
Technical Analysis for Gold Price Prediction (Forex Perspective)

Technical analysis plays a central role in gold price prediction and forex trading, particularly through the XAU/USD pair. Forex traders treat gold similarly to a currency, analyzing its price behavior against the U.S. dollar.

Gold trading in the forex market (XAU/USD)

In the forex market, gold is quoted as XAU/USD, representing the price of one ounce of gold in U.S. dollars. This market is highly liquid and trades nearly 24 hours a day, making it attractive for short-term and long-term strategies.

Gold price prediction forex analysis often focuses on intraday volatility, reaction to economic news, and correlation with other assets such as currencies and bonds.

Moving averages, RSI, MACD, and Fibonacci levels

Moving averages smooth out price data to identify trends. When short-term moving averages cross above long-term ones, it can signal bullish momentum in gold price prediction. RSI helps identify overbought or oversold conditions, while MACD highlights trend strength and potential reversals.

Fibonacci retracement levels are used to identify potential support and resistance based on previous price swings. These levels are widely followed and often influence trading decisions.

Short-term vs long-term technical outlook

Short-term technical outlooks focus on intraday and daily charts, emphasizing quick price movements. Long-term outlooks rely on weekly or monthly charts, highlighting broader trends. Both perspectives are essential for a balanced gold price prediction for future scenarios.

Fundamental Analysis and Gold Price Prediction in the Future

Fundamental analysis examines economic, financial, and geopolitical factors that influence gold prices over time. This approach is essential for understanding gold price prediction in future market conditions.

Economic data impact on gold prices

Economic indicators such as GDP growth, employment data, and inflation reports affect investor confidence and risk appetite. Weak economic data often increases demand for safe-haven assets like gold, supporting higher price forecasts.

Interest rate expectations and inflation outlook

Central bank policies strongly influence gold prices. When interest rates are expected to remain low or decline, gold often becomes more attractive. Inflation expectations also play a key role, as gold is viewed as protection against rising prices.

Long-term investment trends for gold

Long-term gold price prediction for future periods also considers structural trends such as central bank gold purchases, geopolitical uncertainty, and diversification strategies among institutional investors. These factors can support sustained demand over many years.

Short-Term vs Long-Term Gold Price Prediction for the Future

Different time horizons require different approaches to gold price prediction. Short-term forecasts focus on immediate market dynamics, while long-term projections emphasize broader economic trends.

Daily and weekly gold price forecasts

Daily and weekly forecasts rely heavily on technical indicators and market sentiment. Traders monitor price reactions to news events and technical levels to adjust positions quickly.

Monthly and yearly gold price projections

Longer-term projections consider economic cycles, monetary policy trends, and global risk factors. These forecasts are particularly relevant for investors seeking exposure to gold as part of a diversified portfolio.

Bullish, bearish, and sideways scenarios

Gold price prediction often includes multiple scenarios. Bullish scenarios may involve rising inflation and economic uncertainty. Bearish scenarios reflect strong economic growth and higher interest rates. Sideways scenarios occur when opposing forces balance each other.

Latest Gold Price Prediction and Market Outlook

The gold market signals is constantly evolving, making gold price prediction latest updates essential for traders and investors.

Current price action and trend direction

Analyzing current price action helps determine whether gold is trending upward, downward, or moving sideways. Trend direction influences strategy selection and risk management decisions.

Analyst expectations and market consensus

Market analysts publish forecasts based on technical and fundamental analysis. While opinions may vary, consensus views can influence market sentiment and price behavior.

Key levels to watch in upcoming sessions

Identifying critical technical levels helps traders prepare for potential breakouts or reversals. These levels are often referenced in short-term gold price prediction analysis.

Risks That Could Affect Gold Price Predictions

No gold price prediction is free from risk. Sudden geopolitical developments, such as conflicts or political instability, can cause sharp price movements.

Changes in monetary policy, including unexpected interest rate decisions, can quickly alter market expectations.

Market volatility and surprise economic data releases can also invalidate forecasts, highlighting the importance of risk management in gold trading and investing.

Trading and Investment Strategies Based on Gold Price Prediction

Effective strategies are built around a clear gold price prediction framework and disciplined execution.

Day trading vs swing trading gold

Day traders focus on short-term price fluctuations, while swing traders aim to capture larger moves over days or weeks. Each approach requires different tools and time commitments.

Long-term investment strategies

Long-term investors use gold as a hedge and portfolio diversifier. Their strategies are guided by gold price prediction in future economic cycles rather than short-term volatility.

Risk management and position sizing

Risk management is essential in all strategies. Proper position sizing, stop-loss placement, and diversification help protect capital during adverse market conditions.

Conclusion

Gold remains one of the most critical assets in global financial markets, and gold price prediction is a vital tool for navigating its movements. By combining technical analysis, fundamental insights, and market awareness, traders and investors can develop a more structured and informed approach. With platforms like Evest offering access to market analysis and trading tools, participants are better equipped to understand trends, manage risk, and identify opportunities in the gold market.

FAQs

What is a gold price prediction?

Gold price prediction is the process of estimating future gold prices using technical, fundamental, and market analysis.

What affects gold price prediction in the future?

Economic data, interest rates, inflation, currency movements, and geopolitical events all influence future gold price expectations.

How accurate are gold price predictions?

While analysis can improve probability, no prediction is guaranteed due to market uncertainty.

How do gold price prediction charts work?

Charts visualize historical price data, helping traders identify trends, patterns, and key levels.

Is gold price prediction in forex different from other markets?

Gold price prediction forex analysis focuses on XAU/USD trading dynamics, which may differ from physical or futures markets due to liquidity and trading behavior.

Dow Jones Forecast: Market Trends, Analysis, and Future Outlook

The Dow Jones Industrial Average is one of the most recognized stock market indices in the world, often seen as a benchmark for the overall health of the U.S. equity market and, by extension, global financial sentiment. For traders and investors, understanding the Dow Jones Forecast is essential for making informed decisions, managing risk, and identifying opportunities across different market conditions.

The Dow Jones Forecast goes beyond short-term price movements.

Dow Jones forecast – technical analysis.

Technical analysis indicators plays a central role in shaping the Dow Jones Forecast, especially for traders who rely on price action and market behavior rather than economic data alone. By analyzing historical price patterns, volume, and indicators, market participants attempt to anticipate future movements of the index.

Key technical tools include trendlines, support and resistance levels, moving averages, and momentum indicators. When the Dow Jones Industrial Average trades above major moving averages, it often signals bullish sentiment, strengthening the Dow Jones Forecast on the upside.

Conversely, trading below these averages may suggest weakening momentum and increased downside risk.

Chart patterns such as channels, triangles, and head-and-shoulders formations are also closely monitored. These patterns help traders identify potential breakouts, reversals, or periods of consolidation. In many DJIA forecast models, confirmation from multiple indicators is used to increase the reliability of signals.

Momentum indicators like RSI and MACD provide insight into whether the market is overbought or oversold. Extreme readings may indicate potential corrections or rebounds. By combining these tools, technical analysis offers a structured framework for short-term and medium-term Dow Jones projections, helping traders align entries and exits with prevailing trends.

Why Trade the Dow Jones?

The Dow Jones Industrial Average attracts traders and investors for several compelling reasons. First, it represents some of the largest and most influential companies in the U.S. economy, making it a proxy for corporate America’s performance. This broad representation enhances the relevance of the Dow Jones Forecast across global markets.

Liquidity is another significant advantage. Dow-related instruments, including futures and CFDs, are actively traded, resulting in tight spreads and efficient execution. This makes the index suitable for both short-term trading and longer-term positioning.

Volatility also plays a role. While not as volatile as some technology-heavy indices, the Dow offers enough price movement to create consistent trading opportunities. For many traders, this balance makes Dow stock forecast strategies more manageable from a risk perspective.

Additionally, the Dow Jones responds clearly to major economic events, earnings seasons, and policy announcements. This transparency allows traders to connect macroeconomic developments directly to price behavior, enhancing the practical value of Dow Jones Industrial Forecast Analysis.

History of Dow Jones Industrial Average

Understanding the historical context of the Dow Jones Industrial Average provides valuable insight into its long-term behavior and strengthens any Dow Jones Forecast. Established in the late 19th century, the index has evolved alongside the U.S. economy, reflecting industrial growth, technological innovation, and shifts in global power.

Over decades, the Dow has weathered major events such as world wars, economic depressions, financial crises, and periods of rapid expansion. Each cycle has contributed to shaping market psychology and investor expectations. Long-term charts reveal that despite periods of sharp decline, the Dow Jones has historically trended upward, highlighting the resilience of diversified equity exposure.

Changes in index composition also matter. As industries rise and fall, companies are added or removed to maintain relevance. These adjustments ensure that the Dow Jones Industrial Average remains aligned with current economic realities rather than outdated sectors.

By studying historical drawdowns and recoveries, investors gain perspective on risk tolerance and time horizons. This historical awareness supports more balanced Dow Jones projections, especially for long term trading strategies.

Fundamental Analysis and Dow Jones Industrial Predictions

Fundamental analysis examines economic and corporate factors that drive the intrinsic value of the Dow Jones Industrial Average. It is a cornerstone of reliable Dow Jones industrial predictions, particularly for medium-term and long-term outlooks.

Impact of U.S. economic data releases

Economic indicators such as GDP growth, inflation, employment data, and consumer spending significantly influence the Dow Jones Forecast. Strong economic data often supports higher corporate revenues and profits, boosting investor confidence. Conversely, weak data can raise concerns about slowing growth and earnings pressure.

Company earnings within the DJIA

Earnings reports from Dow-listed companies play a direct role in index performance. Since the index is price-weighted, significant price moves in high-value stocks can disproportionately affect the overall index. Positive earnings surprises can strengthen Dow Jones projections, while disappointing results may trigger declines.

Global market influence on Dow Jones performance

Global factors such as international trade conditions, geopolitical developments, and foreign market performance review also impact the Dow. In an interconnected economy, global shocks can quickly influence U.S. equities, making global awareness essential for accurate Dow Jones Forecast assessments.

Dow Stock Forecast: Sector and Stock-Level Insights

Sector performance within the Dow Jones Industrial Average provides deeper insight into the broader Dow stock forecast. While the index includes only 30 companies, these firms span multiple sectors, offering a snapshot of diverse economic activity.

Top-performing Dow Jones stocks

Strong performance from key stocks can drive the index higher. When multiple sectors show strength simultaneously, it reinforces bullish Dow Jones stock prediction scenarios. Investors monitor leadership trends to identify which industries are driving growth.

Weak sectors and risk areas

Underperforming sectors can weigh on the index, especially during economic slowdowns. Identifying weak areas helps traders anticipate potential headwinds and adjust exposure accordingly.

How do individual stocks affect the DJIA?

Because the Dow is price-weighted, individual stocks movements can have an outsized impact. Understanding this structure is essential for interpreting short-term Dow Jones Forecast fluctuations and avoiding misinterpretation of broader market strength or weakness.

Dow Jones Stock Prediction Scenarios

Scenario analysis helps traders and investors prepare for different market outcomes. Each Dow Jones stock prediction scenario is based on varying assumptions about economic conditions, earnings, and sentiment.

Best-case market scenario

In a best-case scenario, strong economic growth, easing inflation, and supportive monetary policy drive sustained equity gains. Corporate earnings exceed expectations, reinforcing optimistic Dow Jones projections.

Worst-case market scenario

A worst-case outlook may involve recession risks, policy tightening, or geopolitical shocks. In this environment, risk aversion rises, and the Dow Jones Forecast turns defensive, with increased volatility and downside pressure.

Neutral and consolidation outlook

Markets do not always trend strongly. Periods of consolidation occur when positive and negative factors balance out. In such cases, range-bound strategies align better with a cautious Dow Jones Industrial Forecast.

Risks That Can Impact the Dow Jones Forecast

Every Dow Jones Forecast is subject to risk. Market volatility driven by geopolitical events can cause sudden price swings that invalidate prior analysis.

Unexpected economic shocks, such as financial crises or abrupt changes in growth expectations, can rapidly alter market sentiment.

Policy and interest rate changes are particularly influential. Central bank decisions affect borrowing costs, valuations, and investor behavior, making them critical variables in Dow Jones projections.

Trading and Investment Strategies Based on Dow Jones Forecasts

Effective strategies align with the prevailing Dow Jones Forecast and individual risk tolerance.

Day trading vs swing trading approaches

Day traders focus on intraday price movements, using technical signals and volatility. Swing traders hold positions for days or weeks, combining technical and fundamental insights.

Long-term investment strategies

Long-term investors emphasize fundamentals, diversification, and compounding. A long-term Dow Jones Industrial Forecast supports strategic asset allocation rather than frequent trading.

Risk management and position sizing

Regardless of strategy, risk management is essential. Proper position sizing, stop-loss use, and diversification protect capital during adverse market conditions.

Conclusion

The Dow Jones Forecast serves as a vital guide for navigating equity markets. By integrating technical analysis, fundamental insights, historical perspective, and scenario planning, traders and investors can develop a more informed and resilient approach. With support from trading platform online like Evest, market participants gain the tools and education needed to interpret Dow Jones projections effectively and adapt to changing market environments.

FAQs

What is the Dow Jones Forecast?

The Dow Jones Forecast represents expectations about the future performance of the Dow Jones Industrial Average based on technical, fundamental, and market analysis.

How accurate is the DJIA forecast?

Accuracy improves with comprehensive analysis, but market uncertainty means no forecast is guaranteed.

What factors influence Dow Jones projections?

Economic data, corporate earnings, global events, and monetary policy all influence Dow Jones projections.

Is the Dow Jones Industrial forecast reliable for long-term investing?

While short-term fluctuations occur, the Dow Jones Industrial forecast has historically supported long-term investment strategies when combined with proper risk management.

Gold Price Forecasts: Latest Trends & Market Outlook

Gold has been a cornerstone of wealth and financial security for centuries, serving as both a store of value and a hedge against economic uncertainty. Today, investors, traders, and institutions closely monitor gold price forecasts to make informed decisions about buying, selling, or holding this precious metal. With markets becoming increasingly interconnected and influenced by a myriad of factors, understanding the latest trends and future projections is crucial.

The purpose of this article is to provide a comprehensive overview of gold price forecasts, covering key factors that influence gold prices, trends predicted for 2025, and strategies for both short-term traders and long-term investors. 

What is Gold and What Affects Its Price?

Gold is a precious metal that has long been regarded as a symbol of wealth and security. Unlike fiat currencies, it cannot be printed or artificially manipulated, making it a finite and tangible asset. Its price is determined by a combination of factors that reflect global economic conditions, investor sentiment, and supply-demand dynamics.

Primary factors influencing gold prices include:

  1. Global Economic Conditions and Inflation: Gold is often seen as a hedge against inflation. When currencies lose purchasing power, investors turn to gold, driving its price higher. Economic instability, recession fears, or fiscal crises tend to increase demand for gold as a safe-haven asset.
  2. Interest Rates and Currency Fluctuations: Rising interest rates generally increase the opportunity cost of holding gold, leading to lower demand. Conversely, when interest rates are low or negative, gold price forecasts often show an upward trajectory. Additionally, fluctuations in major currencies, particularly the U.S. dollar, directly affect gold prices, as it is primarily traded in USD.
  3. Geopolitical Tensions and Market Uncertainty: Conflicts, political instability, or tensions between nations often lead investors to flock to gold. Events like wars, sanctions, or international disputes create uncertainty, making gold a preferred choice for capital preservation.
  4. Supply and Demand Dynamics: The production of gold from mines, recycling of old jewelry, and industrial demand all affect prices. When demand outpaces supply, prices rise; conversely, an oversupply can suppress gold price expectations.

Understanding these fundamentals is crucial for interpreting gold price predictions and forming strategies to capitalize on market movements.

Factors Influencing Gold Prices

A complex interplay of economic, financial, and geopolitical factors influences the movement of gold prices. Here’s a deeper look:

  • Global Economic Conditions and Inflation: Persistent inflation reduces the real value of cash, making gold a preferred store of value. Historical data suggests that during periods of high inflation, gold price forecasts tend to indicate bullish trends.
  • Interest Rates and Currency Fluctuations: Low-interest rates reduce the yield on bonds and savings accounts, pushing investors toward gold. Fluctuations in the U.S. dollar also have a significant impact. A weaker USD generally results in higher gold prices, while a stronger USD can depress them.
  • Geopolitical Tensions and Market Uncertainty: Global events like trade wars, military conflicts, and political instability increase the appeal of gold as a hedge. Investors often respond by buying gold, affecting both spot prices and futures contracts.
  • Supply and Demand Dynamics: Gold mining output, the sale of gold reserves by central banks, and consumer demand for jewelry and technology all play critical roles. Seasonal demand, particularly in countries like India and China, can also impact gold market forecasts.

By monitoring these factors, traders can align their decisions with broader market trends and refine their gold price predictions for both short-term trading and long-term investment.

Gold Market Forecast 

Looking ahead to 2026, analysts and financial institutions provide gold market forecasts based on a combination of historical trends, current economic indicators, and geopolitical events.

  • Predicted Trends: Experts expect gold to continue its role as a safe-haven asset, with price fluctuations linked closely to inflation, interest rate movements, and geopolitical stability. Short-term volatility may arise from unexpected economic announcements, while long-term trends suggest steady appreciation in response to global uncertainty.
  • Short-Term vs Long-Term Forecasts: Short-term gold price predictions are often influenced by daily market sentiment, currency movements, and trading volume. Long-term forecasts, however, focus on macroeconomic conditions, monetary policy trends, and structural changes in supply and demand.
  • Key Signals to Watch: Traders should observe central bank announcements, inflation reports, bond yields, and significant geopolitical developments. Evest Technical analysis tools like gold charts and USD correlation graphs also provide critical insight into potential price movements.

Overall, the 2025 outlook for gold remains cautiously optimistic, with potential for both strategic investment gains and hedging benefits.

Gold Price Forecasts Expectations

Setting realistic gold price expectations requires a blend of historical analysis, current market trends, and forward-looking indicators.

  • Using Historical Data: Past price movements provide context for future predictions. Patterns, cyclical trends, and historical highs and lows inform gold price forecasts.
  • Analytical Tools: Investors rely on gold charts, gold graphs, and market signals to interpret price action. Technical indicators like moving averages, RSI, and MACD help gauge market sentiment.
  • Impact of Financial News: Global economic updates, central bank reports, and trade announcements influence expectations. Markets react swiftly to news, affecting both spot and futures prices.

By incorporating these tools, investors can develop informed gold price predictions that guide their trading and long-term investment strategies.

Gold Investment Forecast

A well-researched gold investment forecast considers opportunities for both traders and long-term investors:

  • Opportunities: Gold offers portfolio diversification, risk mitigation, and potential capital appreciation. It can be invested in physical form, ETFs, futures contracts, or gold mining stocks.
  • Risks: Despite its safe-haven status, gold is subject to market volatility, geopolitical events, and currency fluctuations. Investors should be prepared for potential short-term losses.
  • Comparisons: When evaluating gold, investors often compare it with other commodities, equities, or bonds. Gold typically performs well during economic uncertainty, making it a defensive asset in turbulent markets.

A thoughtful approach to gold investment forecasts allows investors to balance risk and reward effectively.

How to Use Gold Price Predictions

Using gold rate forecasts effectively requires a combination of strategy, timing, and risk management:

  • Buying and Selling Decisions: Investors can plan entry and exit points using technical analysis and market indicators. Gold price predictions inform whether to buy during dips or sell during rallies.
  • Trading Strategies: Incorporating forecasts into trading strategies can enhance decision-making. Trend-following, swing trading, and hedging strategies benefit from accurate projections.
  • Investment Planning: Long-term investors use gold price expectations to structure their portfolios, ensuring allocation aligns with risk tolerance and market outlook.

By leveraging forecasts, traders and investors can make informed decisions, maximize returns, and minimize exposure to adverse market movements.

Conclusion

Gold price forecasts play a critical role in shaping investment strategies for traders and long-term investors alike. By understanding the factors that influence gold prices, monitoring market signals, and using historical data for reference, investors can make informed decisions and better manage risk.

FAQs

What are gold price forecasts, and why are they important?

Gold price forecasts are predictions of future gold price movements based on historical data, economic indicators, and market trends. They help investors make informed buying and selling decisions and manage risk.

How do experts predict future gold prices?

Experts use a combination of technical analysis, macroeconomic indicators, historical trends, and geopolitical developments to generate gold price predictions.

What factors most influence gold price predictions?

Inflation, interest rates, currency strength, geopolitical tensions, and supply-demand dynamics are the primary factors influencing gold market forecasts.

How accurate are gold market forecasts?

While forecasts provide valuable insights, they are not guarantees. Gold prices can be affected by sudden economic events or geopolitical crises, so forecasts should be used alongside risk management strategies.

Your Guide to the Vanguard 500 Index Fund ETF

The Vanguard 500 Index Fund ETF has become one of the most recognized investment vehicles in the financial world. This exchange-traded fund (ETF) is designed to replicate the performance of the S&P 500, a benchmark index representing 500 of the largest U.S. publicly traded companies. For investors seeking exposure to the U.S. equity market, understanding the intricacies of the Vanguard 500 Index Fund ETF is crucial.

Understanding the Vanguard S&P 500 ETF

The Vanguard S&P 500 ETF is designed to track the performance of the S&P 500 index. The S&P 500 is widely regarded as a benchmark for the U.S. stock market, representing approximately 80% of the total market capitalization of U.S. equities. This ETF provides investors with a simple way to gain exposure to the broader U.S. economy without having to purchase individual stocks.

Key features of the Vanguard S&P 500 Index ETF include:

  • Diversification: By investing in 500 companies, the ETF reduces the risk associated with individual stock fluctuations.
  • Cost-effectiveness: Vanguard ETFs are known for low expense ratios, making them attractive to both retail and institutional investors.
  • Liquidity: The ETF can be traded on major exchanges, allowing investors to buy and sell shares throughout the trading day.
  • Performance Tracking: The fund closely mirrors the performance of the S&P 500, providing returns aligned with the broader U.S. stock market trading.

Investors can monitor the ETF S&P 500 Vanguard performance through charts and graphs, comparing it with other indices or benchmarks. Understanding the structure and objectives of the ETF is the first step in integrating it into a well-rounded investment strategy.

Vanguard 500 Index Fund (VOO) Details

The Vanguard 500 Index Fund, commonly referred to as VOO stock, is one of the flagship ETFs offered by Vanguard. Launched to provide investors with efficient exposure to the S&P 500, VOO has steadily gained popularity due to its low fees, transparency, and reliability.

Key Details Include:

  • Expense Ratio: VOO has one of the lowest expense ratios among S&P 500 ETFs, typically under 0.05%, allowing investors to keep more of their returns.
  • Dividend Yield: Investors receive dividends from the underlying stocks, which are distributed periodically, providing a consistent income stream.
  • Market Capitalization Weighting: The ETF weights its holdings based on market capitalization, giving larger companies like Apple, Microsoft, and Amazon a more significant influence on performance.
  • Accessibility: VOO is easily accessible through major brokers and trading platforms, making it simple for both beginners and experienced investors to trade.

Investing in Vanguard S&P 500 through VOO ensures exposure to a wide array of industries, including technology, healthcare, finance, and consumer goods. The fund’s design allows investors to benefit from long-term market growth while mitigating the risk of individual stock volatility.

How To Invest in the Vanguard 500 Index Fund ETF?

Investing in the Vanguard 500 Index Fund ETF is straightforward, but it requires understanding several steps:

  1. Select a Brokerage Account: Choose a brokerage platform that offers access to ETFs. Look for low trading fees, easy-to-use interfaces, and research tools.
  2. Fund Your Account: Deposit sufficient funds into your brokerage account to purchase VOO shares. Vanguard ETFs can be bought in whole or fractional shares, depending on the platform.
  3. Place an Order: Investors can use market orders, limit orders, or stop orders to buy VOO. Market orders execute immediately at the current price, while limit orders allow investors to set a preferred purchase price.
  4. Monitor Your Investment: Track the VOO stock performance through charts, news, and updates. Regular monitoring ensures alignment with investment goals and risk tolerance.
  5. Reinvest Dividends: Investors can choose to reinvest dividends automatically to take advantage of compounding returns.

By following these steps, investors can gain exposure to the Vanguard S&P 500 ETF efficiently while minimizing costs and administrative hurdles.

Why Vanguard ETFs Remain Popular with UK Investors in 2025?

Vanguard ETFs, including the Vanguard 500 Index Fund ETF, continue to attract UK investors due to several key factors:

  • Low Costs: Vanguard’s commitment to minimal expense ratios appeals to investors seeking maximum returns.
  • Diversification: ETFs provide exposure to hundreds of companies, reducing reliance on individual stock performance.
  • Regulatory Trust: Vanguard is globally recognized, with strong compliance standards that reassure UK investors.
  • Tax Efficiency: ETFs often generate lower capital gains distributions than mutual funds, providing potential tax advantages.
  • Ease of Access: UK investors can purchase Vanguard ETFs through multiple trading platforms, making investment convenient and flexible.

The Vanguard S&P 500 ETF is beautiful because it provides international exposure to the U.S. market, historically one of the strongest-performing equity markets.

Top Vanguard ETFs for Broad Market Exposure

Beyond VOO, Vanguard offers a range of ETFs that provide broad market exposure:

  • Vanguard Total Stock Market ETF (VTI): Covers the entire U.S. stock market, including small-cap and mid-cap stocks.
  • Vanguard FTSE All-World ETF (VEU): Offers international equity exposure across developed and emerging markets.
  • Vanguard Growth ETF (VUG): Focuses on high-growth U.S. companies with potential for long-term capital appreciation.

Investors looking to diversify beyond the S&P 500 can consider these options to balance their portfolios and reduce reliance on a single index.

Dividend & Income: Top Vanguard ETFs for Yield Seekers

For income-focused investors, several Vanguard ETFs offer attractive dividends:

  • Vanguard High Dividend Yield ETF (VYM): Focuses on U.S. companies with above-average dividend yields.
  • Vanguard Dividend Appreciation ETF (VIG): Invests in companies with a history of consistently increasing dividends.

These ETFs provide steady income streams, making them suitable for investors seeking golden dividends while still enjoying exposure to the broader market.

Example Vanguard ETF Portfolios by Risk Level

Example Vanguard ETF portfolios by risk level show how different combinations of funds can match various investment goals. They help illustrate general asset allocation approaches without specific financial advice.

Higher Risk – Chasing Returns

Aggressive investors may focus heavily on growth-oriented ETFs like VUG and VOO, aiming for high returns while accepting greater volatility.

Medium Risk – Balanced Approach

A balanced portfolio could combine VOO, VTI, and VIG, providing growth potential alongside moderate income and reduced volatility.

Lower Risk – Targeting Steady Growth

Conservative investors may prefer a mix of VOO, VIG, and bond ETFs, prioritizing steady growth and income with lower exposure to market swings.

Conclusion

The Vanguard 500 Index Fund ETF represents a cornerstone investment for both new and experienced investors seeking exposure to the U.S. equity market. Its low costs, diversification, and ease of access make it a powerful tool for building a balanced portfolio. Whether investors are focused on growth, income, or a combination, VOO and other Vanguard ETFs provide flexibility and efficiency.

By understanding Vanguard s&p 500 trading, monitoring VOO stock, and leveraging tools like the ETF S&P 500 Vanguard, investors can make informed decisions to achieve long-term financial goals. Vanguard ETFs continue to remain popular due to their transparency, reliability, and strong historical performance.

Faqs

How To Invest in the Vanguard S&P 500 ETF

Invest through a brokerage account, fund it, place market or limit orders, and monitor your investment regularly. Reinvest dividends for compounding growth.

What Vanguard ETF Tracks the S&P 500?

The Vanguard 500 Index Fund ETF (VOO) directly tracks the performance of the S&P 500.

Which Is Better, S&P 500 or VOO?

VOO provides direct, low-cost exposure to the S&P 500, making it an efficient vehicle to replicate index performance.

Is the Vanguard S&P 500 ETF Good for Diversification?

Yes, it offers diversified exposure to 500 U.S. companies across various sectors.

How Does the Vanguard S&P 500 ETF Compare to Other S&P 500 Index Funds?

VOO is known for its low expense ratio, high liquidity, and strong tracking of the S&P 500, making it a preferred choice among investors globally.

Trading account types

For anyone starting in forex trading, understanding trading account types is fundamental to building a successful trading journey. Choosing the correct account can significantly affect your trading experience, risk exposure, and potential profitability. Evest, a trusted online trading platform, offers a wide range of account options that cater to beginners, intermediate, and advanced traders.

A trading account type determines critical aspects such as leverage, spreads, minimum deposit requirements, and available instruments. 

What Are Trading Account Types?

A trading account type is the structure under which a trader accesses financial markets through a broker. It defines the rules, conditions, and features available for trading, such as spreads, leverage, commissions, and instruments.

In forex market trading, the account type is crucial because it directly impacts trading costs, execution speed, and risk management. Selecting the wrong account type can lead to unnecessary losses or limit the trader’s ability to execute strategies efficiently.

How Trading Accounts Work?

Trading accounts function as a bridge between the trader and the financial markets. Funds deposited into the account are used to open positions on currency pairs, commodities, indices, or other instruments. The account type determines the way orders are executed, the trading tools available, and the broker’s level of involvement in the transaction.

For example, some accounts offer fixed spreads, while others have variable spreads influenced by market conditions. Similarly, leverage levels vary between accounts, affecting potential profits and losses.

Differences Between Standard Trading Accounts vs Forex-Specific Accounts

While standard trading accounts may offer access to multiple financial instruments like stocks, commodities, and ETFs, forex-specific accounts are optimized for currency trading. Forex accounts typically offer:

  • Higher leverage options are suitable for forex markets.
  • Specialized order execution and trading platforms designed for forex.
  • Access to minor and exotic currency pairs.
  • Tailored spreads to reduce trading costs for high-volume currency trades.

Understanding these differences helps beginners choose an account that aligns with their trading goals and risk tolerance.

Forex Trading Account Types Explained

Forex trading account types are designed to suit different trading needs and experience levels. They provide users with options to access the market in ways that match their goals and trading style.
What Makes Forex Accounts Unique?

What Makes Forex Accounts Unique?

Forex accounts are specifically designed to trade currency pairs efficiently. Unlike standard trading accounts, they offer:

  • Flexible leverage: Forex accounts often provide higher leverage than stock trading accounts, allowing traders to control larger positions with a smaller capital outlay.
  • Narrow spreads: Forex trading typically has tighter spreads, which reduces trading costs.
  • Currency pair diversity: Access to major, minor, and exotic pairs, enabling diversified trading strategies.

Overview of Common Forex Account Structures

Most brokers, including Evest, offer several forex trading account types, such as:

  1. Standard Accounts – For experienced traders seeking competitive spreads and moderate leverage.
  2. Mini/Micro Accounts – Ideal for beginners or low-capital traders, allowing smaller trade sizes and lower risk exposure.
  3. Islamic Accounts – Swap-free accounts for traders observing Islamic finance principles.
  4. Demo Accounts – Risk-free accounts for beginners to practice strategies and get familiar with platforms.

Each type serves a distinct purpose, catering to different levels of experience, risk tolerance, and trading goals.

Standard Account

Features

Professional and active traders commonly use standard accounts. Features include:

  • Variable spreads or tight fixed spreads.
  • Leverage options range from 1:50 to 1:500.
  • Access to a broad range of currency pairs, commodities, and indices.
  • Professional-level trading platforms with advanced charting tools.

Ideal Users

These accounts are suitable for traders who have experience in forex, are comfortable with leverage, and aim for higher trading volumes.

Pros and Cons

Pros:

  • Competitive spreads and execution speeds.
  • Access to advanced analytical tools.
  • Greater potential for profit due to leverage.

Cons:

  • Higher risk due to leverage exposure.
  • Minimum deposit requirements may be higher than beginner accounts.

Minimum Deposit & Spread Levels

Evest’s standard accounts typically require a moderate initial deposit, with spreads that vary according to market conditions and account type. Traders benefit from better trading conditions as their volume and experience increase.

Islamic Forex Accounts

Swap-Free Structure

Islamic accounts, also known as swap-free accounts, comply with Sharia law by eliminating overnight interest charges on positions. This structure is ideal for long-term traders who wish to maintain positions without paying or earning interest.

Who Should Choose an Islamic Trading Account

Traders who practice Islamic finance or those seeking to hold positions longer without accumulating swap charges benefit from these accounts. Evest provides fully compliant swap-free accounts with access to standard online trading tools and platforms, making it easier for traders to participate ethically and efficiently.

Demo Accounts for Beginners

Importance of Demo Trading Before Opening a Real Forex Account

Demo accounts are essential for beginners to practice trading without financial risk. They allow users to:

  • Familiarize themselves with platform features.
  • Understand spreads, leverage, and order execution.
  • Test various forex trading account types before committing real funds.

How to Test Strategies

Demo accounts provide an ideal environment to develop, backtest, and refine trading strategies. Traders can simulate different market conditions and risk scenarios, ensuring their strategies are robust before going live.

Connecting With: Trade Forex Account Transition

Once confident, traders can smoothly transition from a demo account to a live trade forex account, applying lessons learned without unnecessary stress. Evest’s demo-to-live transition process is seamless, allowing users to migrate balances and experience with minimal friction.

How to Choose the Best Forex Account

Key Factors: Spreads, Leverage, Commission, Platform

Selecting the best forex account depends on several factors:

  • Spreads: Lower spreads reduce trading costs.
  • Leverage: Balance leverage with risk tolerance.
  • Commission: Account for transaction fees and commissions.
  • Platform: Ensure the platform offers intuitive charts, indicators, and execution speed.

Trading Style Consideration

The ideal account should align with your trading style—scalping, day trading, swing trading, or long-term investing.

Recommended Best Forex Account Options for New Traders

Beginners often benefit from demo accounts, mini/micro accounts, or swap-free accounts to learn trading basics safely while gradually increasing capital and experience.

Trading Account Types Comparison

Account Type Ideal For Minimum Deposit Leverage Spread Type Swap-Free
Standard Account Experienced Traders Moderate 1:50 – 1:500 Variable/Tight No
Mini/Micro Account Beginners Low 1:10 – 1:100 Variable Optional
Islamic Account Sharia-compliant Moderate 1:50 – 1:200 Variable/Tight Yes
Demo Account All Levels None Simulated Simulated N/A

This comparison helps traders select the account type that best suits their experience level and trading goals.


Final Tips for Selecting the Right Account Type

Choosing the correct trading account involves considering personal goals, experience level, and market preferences. Making an informed selection can help traders manage their activities more effectively and confidently.

Evaluating Your Capital

Assess your available funds and risk tolerance before choosing a trading account. Small capitals benefit from mini or demo accounts.

Your Experience Level

Beginners should prioritize demo accounts and micro accounts to learn without significant risk, while experienced traders may opt for standard accounts.

Your Trading Style: Scalping, Day Trading, Swing Trading

Scalpers require accounts with tight spreads and fast execution. Swing traders benefit from flexible leverage, while day traders may prioritize low commissions and high liquidity.

Conclusion

Understanding trading account types is crucial for a successful forex trading journey. Evest offers a range of accounts—standard, Islamic, demo, and micro—that cater to different experience levels and trading styles. Beginners benefit from demo trading accounts and micro accounts to learn risk management and platform navigation. Experienced traders gain advanced features, leverage, and diverse instruments in standard accounts. Selecting the correct account aligns trading strategies with risk tolerance and financial goals, creating a foundation for long-term success in forex trading.

FAQs

What are the most common forex trading account types available for beginners?

The most common accounts include demo accounts, micro/mini accounts, and swap-free Islamic accounts.

Which trading account type offers the lowest spreads?

Standard accounts typically offer the tightest spreads, especially for major currency pairs.

What is the difference between a standard account and a micro account?

A standard account allows larger trade sizes, higher leverage, and tighter spreads, whereas a micro account is ideal for beginners, with smaller trade sizes and lower risk.

Are Islamic trading accounts available in forex?

Yes, many brokers, including Evest, offer swap-free accounts to comply with Islamic finance principles.

What is the best forex account type for beginners?

Demo accounts or micro accounts are generally recommended for beginners to learn trading basics and build confidence before trading real money.

Start Trading Safely with Forex Demo Accounts

For anyone entering the world of forex trading, the concept of forex demo accounts is a critical starting point. Forex trading involves significant financial risk, and beginners often face steep learning curves as they try to navigate currency pairs, Leverage, and complex trading strategies. A forex trading demo account allows traders to practice without risking real money, providing a safe and effective learning environment.

How Demo Trading Differs from Live Trading?

Forex demo accounts mimic live trading environments but have some crucial differences that traders need to understand. In a demo account, traders use virtual money to execute trades. While the market conditions—prices, spreads, and volatility—are generally reflective of fundamental markets, there are key psychological and practical distinctions.

  1. No Financial Risk: The most apparent difference is the absence of real financial exposure. This eliminates fear and emotional stress, which are significant factors in live trading mistakes. Beginners often underestimate the psychological challenges in trading real money, where emotions like fear and greed influence decisions.
  2. Execution Speed: Some brokers simulate order execution in demo accounts, which may differ slightly from real-time market execution. For instance, slippage may not always be replicated, which can give beginners a slightly distorted view of real trading conditions.
  3. Psychological Experience: Trading with a demo account cannot fully replicate the emotional pressure associated with real trading. While one can practice strategy and decision-making, the adrenaline of potential losses or gains is absent.
  4. No Market Impact: Large trades in live accounts can influence market prices slightly, especially in less liquid instruments. In demo trading, all trades are executed without any market impact.
  5. Risk-Free Experimentation: Demo accounts allow traders to test extreme strategies without worrying about capital loss. This flexibility is beneficial when experimenting with different forex trading strategies, such as scalping, swing trading, or trend following.

Understanding these differences ensures traders use demo accounts effectively as a learning tool, bridging the gap between theoretical knowledge and real trading experience.

Making Forex Demo Accounts More Realistic

To maximize the value of forex demo accounts, traders should aim to simulate real trading as closely as possible. Evest’s demo accounts offer features that enhance realism and prepare traders for live markets.

  1. Using Realistic Account Balances: Set your demo account balance to mirror what you would realistically invest. This helps in understanding position sizing, Leverage, and risk management in forex trading more accurately.
  2. Applying Leverage Wisely: Demo accounts often allow traders to use maximum Leverage. It’s crucial to practice with realistic leverage ratios to understand both potential profits and risks.
  3. Trading on Real-Time Data: Ensure the demo account updates in real-time, reflecting current market spreads, price movements, and economic news impacts. Evest’s platform offers live data feeds, which help simulate authentic trading conditions.
  4. Tracking Emotions: Even though demo accounts use virtual money, treat it as real capital. Maintaining discipline in following stop-loss levels, risk management strategies, and trading plans helps in developing strong trading habits.
  5. Simulating Different Market Conditions: Actively monitor market volatility, news releases, and economic events while trading your demo account. This approach provides experience in handling sudden price swings and understanding market behavior.

By making a demo currency trading account more realistic, traders can develop skills and habits that directly translate into live trading confidence and competence.

Advantages of Starting Forex Trade with a Demo Account

There are numerous benefits to starting your trading journey with forex demo accounts:

  1. Risk-Free Learning: Beginners can understand trading basics, practice technical analysis, and execute demo account trading in forex without risking capital.
  2. Familiarity with Platforms: Demo accounts allow traders to explore Evest’s interface, charting tools, and order types. Familiarity with the trading platform improves efficiency when moving to real accounts.
  3. Testing Strategies: Traders can experiment with different forex trading strategies, including scalping, swing trading, or news-based approaches, and refine them before applying them in live markets.
  4. Confidence Building: Repeated practice in demo accounts develops confidence in decision-making, risk assessment, and trade execution.
  5. Understanding Market Mechanics: Demo accounts expose traders to spreads, slippage, margin requirements, and leverage effects, helping them learn practical aspects of forex trading that are often overlooked in theory.
  6. Safe Introduction to Volatility: Market fluctuations can be daunting. Using a forex trading demo account allows traders to experience volatility without the financial pressure, helping them develop patience and discipline.
  7. Evaluation of Performance: Traders can track their performance over time, identify strengths and weaknesses, and adjust strategies accordingly.

Starting with a demo trade account is a strategic step for anyone aiming for long-term success in forex trading.

How to Select the Right Broker for Creating a Demo Account?

Selecting the right broker is critical for a practical forex trading demo account experience. Key considerations include:

  1. Regulation and Trustworthiness: Choose a broker regulated by reputable financial authorities to ensure safety and reliability.
  2. Demo Account Features: Ensure the demo account includes realistic spreads, leverage options, and access to all platform features.
  3. Asset Availability: A good broker should allow trading across multiple currency pairs and instruments, providing a complete learning experience.
  4. Support and Resources: Check if the broker offers educational resources, tutorials, and customer support for demo users.
  5. Ease of Transition to Live Trading: Ensure the broker allows seamless transfer from demo to live accounts to avoid complications when you start real trading.

Evest’s demo trading accounts are designed with all these considerations, making it easier for beginners and intermediate traders to develop essential skills.

When Should You Transition from Forex Demo Accounts to a Real Account?

While forex demo accounts are invaluable for learning, transitioning to a live account is necessary to gain a whole trading experience. Indicators for readiness include:

  1. Consistent Profits: Demonstrating the ability to make consistent gains in a demo account over several months shows readiness for live trading.
  2. Understanding of Risk Management: Mastery of stop-loss placement, position sizing, and leverage management indicates preparation.
  3. Emotional Preparedness: If you can follow trading plans in a demo without impulsive decisions, you are better equipped to handle real market pressures.
  4. Familiarity with Platform: Comfort with all features of the trading platform ensures smooth execution during live trading.
  5. Testing Strategies: Once strategies have been validated in the demo environment, transitioning to a live account allows testing under real conditions with real financial stakes.

Demo Account Features

A forex trading demo account includes several features that mirror live trading environments:

  1. Real-Time Quotes: Access to live market prices ensures realistic trading conditions.
  2. Order Types: Execute market, limit, stop-loss, and take-profit orders.
  3. Leverage Options: Practice using Leverage safely to understand its effects on potential gains and losses.
  4. Analytical Tools: Charts, indicators, and trend analysis tools help refine trading strategies.
  5. Performance Tracking: Keep track of profits, losses, and trading metrics to evaluate skill development.
  6. Multiple Currency Pairs: Trade major, minor, and exotic currency pairs to diversify learning.

These features collectively make the best forex demo account a powerful educational resource for beginners and experienced traders alike.

What Can You Trade with a Demo Account?

With a demo digital currency trading account, traders can access a wide variety of instruments, including:

  1. Major Forex Pairs: USD/EUR, USD/JPY, USD/CHF, etc.
  2. Minor and Exotic Pairs: These pairs offer exposure to global currencies with varying liquidity.
  3. Indices and Commodities: Some demo accounts allow practice trading on global indices, gold, oil, and other commodities.
  4. Cryptocurrencies: For brokers offering crypto trading, demo accounts provide a safe environment to understand this volatile market.

This diversity allows traders to explore different markets, learn trading nuances, and test strategies comprehensively.

Skill Development Through Demo Trading

Demo trading provides a practical way to develop trading skills in a risk-free environment. It allows users to practice and gain experience while becoming more comfortable with market platforms and tools.

Technical Analysis

Demo accounts let traders practice chart reading, using indicators, and identifying trends without risking capital. Mastery of technical analysis is crucial for profitable trading.

Strategy Development and Backtesting

Traders can develop strategies, backtest them against historical data, and refine their approach to optimize performance.

Risk and Money Management

Practicing risk management techniques, such as calculating lot sizes and setting stop-loss levels, is critical in preparing for live markets.

Emotional Control

Even in a demo account, traders can simulate the discipline required for live trading by sticking to plans and avoiding impulsive decisions.

Conclusion

Forex demo accounts provide an essential learning platform for traders at all levels. They offer a risk-free environment to practice strategies, understand trading platforms, and develop critical skills like technical analysis, risk management, and emotional discipline.

Online trading platform by Evest deliver realistic market conditions, advanced tools, and supportive resources that bridge the gap between theory and real trading. Using a demo account effectively prepares traders for the challenges and opportunities of live forex trading, ensuring a smoother and more confident transition.

FAQs

How long do forex demo accounts last?

Most brokers, including Evest, offer demo accounts with unlimited access or predefined durations, often ranging from 30 days to 90 days. Some allow renewal at any time.

Can I renew my demo account?

Yes, demo accounts can typically be renewed or reactivated, allowing continued practice and skill development.

What is the difference between a demo account and a live trading account?

The key difference is financial risk. A demo account uses virtual funds for practice, whereas a live account involves real money, requiring strict risk management and emotional discipline.

What Is USD to CHF? Essential Basics for Traders & Investors

Understanding forex trading starts with knowing the major currency pairs and how their exchange rates operate. One such pair that draws attention among traders worldwide is the USD/CHF, representing the value of the US dollar against the Swiss franc. For traders, knowing what USD to CHF is is crucial, as this pair is widely used for hedging, speculation, and safe-haven investments.

The USD/CHF currency pair is highly liquid, offers consistent price movements, and provides a unique opportunity to analyze global economic dynamics. Platforms like Evest offer advanced tools, charts, and signals to help traders monitor USD CHF charts, track trends, and execute trades efficiently.

What Does USD CHF Mean?

USD/CHF refers to a commonly traded currency pair in the global foreign exchange market, representing the relationship between two major world currencies:

Definition of USD/CHF as a Forex Currency Pair

USD/CHF is a currency pair where the US dollar (USD) is the base currency and the Swiss franc (CHF) is the quote currency. The exchange rate represents how many Swiss francs are needed to purchase one US dollar. For example, if USD/CHF is 0.9250, it means 1 USD equals 0.9250 CHF.

Why the US Dollar and Swiss Franc Are Commonly Traded?

The US dollar is the most traded currency in the world due to its global acceptance, economic influence, and status as a reserve currency. The Swiss franc is considered a safe-haven currency due to Switzerland’s economic stability, low inflation, and strong banking system. The combination of these two currencies attracts traders who seek both liquidity and stability.

How Traders Interpret the Price of USD/CHF?

Traders use USD/CHF prices to gauge market sentiment. A rising USD/CHF rate indicates a stronger US dollar relative to the Swiss franc, while a declining rate shows franc strength. Understanding these movements, alongside economic and geopolitical factors, is essential for making informed trading decisions.

How Does USD/CHF Trading Work?

USD/CHF trading involves analyzing the price movement between two major currencies within the foreign exchange market.

Base Currency vs Quote Currency

In USD/CHF, the US dollar is the base currency and the Swiss franc is the quote currency. Buying USD/CHF means buying USD while selling CHF, and selling USD/CHF involves selling USD to buy CHF.

How to Read USD/CHF Price?

The price shows how much of the quote currency (CHF) is required to purchase one unit of the base currency (USD). Traders use this information to plan entries and exits in forex positions.

Liquidity and Volatility of the Pair

USD/CHF is moderately volatile compared to other major pairs, providing opportunities for both short-term traders and long-term investors. Its liquidity ensures tight spreads and efficient trade execution, which is crucial for effective risk management.

Factors That Influence the USD/CHF Exchange Rate

The USD/CHF exchange rate is shaped by a range of global and market-related factors that affect currency movements:

US Economic Data

Economic indicators like GDP, unemployment rates, and consumer spending affect the USD. Positive data strengthens the USD, whereas weaker data can lead to depreciation.

Swiss Economic Stability

Switzerland’s stable economy and prudent fiscal policies make the CHF a preferred safe-haven. Changes in Swiss economic conditions influence USD/CHF movements.

Safe-Haven Demand for the Swiss Franc

During global uncertainty, investors flock to CHF due to its reputation as a low-risk currency. This demand can strengthen CHF relative to USD, impacting the USD/CHF rate.

Interest Rates from the Federal Reserve & Swiss National Bank

Monetary policies, including interest rate adjustments, directly impact currency valuation. Higher US interest rates tend to strengthen the USD, while changes in Swiss rates affect the CHF demand.

How to Exchange USD to CHF? 

Exchanging USD to CHF involves converting one currency into another through recognized financial channels:

Where and How to Exchange the Currency?

USD can be exchanged for CHF via banks, forex brokers, or online trading platforms like Evest. Each method has its own costs, spreads, and execution speeds.

Costs, Spreads, and Conversion Fees

Traders should consider the cost of transactions, including spreads (the difference between buying and selling prices) and additional fees. Lower costs improve profitability in forex trading.

Online Tools to Check Live Conversion

Platforms like Evest offer live USD CHF charts and conversion tools, making it easier for traders to monitor rates and execute trades efficiently.

USD CHF Chart: How to Read It? 

A USD/CHF chart visually shows how the exchange rate moves over time in the financial markets. It helps users observe price changes and understand general market direction without focusing on detailed analysis.

Types of Charts

Line charts show overall trends, while candlestick charts provide detailed insights into price movements with open, high, low, and close data.

Price Movement Basics

Charts help traders identify bullish or bearish trends, detect volatility, and plan trade entries and exits.

Timeframes for Analysis

Traders analyze charts across different timeframes—short-term for scalping trading or day trading, long-term for swing or position trading—to align strategies with market behavior.

Understanding What Is USD to CHF Graph Is

Understanding a USD to CHF graph helps illustrate how the exchange rate between the two currencies changes over time.

Trend Analysis (Uptrend, Downtrend, Sideways)

The USD CHF graph helps identify prevailing trends. Uptrends indicate USD strength, downtrends indicate CHF strength, and sideways movements signal consolidation.

Support and Resistance

Support and resistance levels indicate price points where the market may reverse or stall, providing valuable signals for trading decisions.

What the Graph Reveals About Market Sentiment

Analyzing the graph shows trader behavior, investor confidence, and market expectations, helping traders anticipate potential price movements.

USD CHF Signals: Should You Use Them?

USD/CHF signals are tools used to highlight potential market movements based on general market activity. Traders often reference them to gain insight into possible trends without relying on detailed decision-making.

What are Trading Signals? 

USD CHF signals are alerts generated based on technical indicators or market analysis, suggesting potential trade opportunities.

Technical Indicators Commonly Used for USD/CHF

Indicators such as moving averages, RSI, MACD, and Bollinger Bands help traders identify trends, momentum, and potential reversals.

Pros & Cons of Following Forex Signals

Signals can guide inexperienced traders, but relying solely on them without understanding the market can be risky. Combining signals with personal analysis improves decision-making.

Best Trading Strategies for USD/CHF

Choosing suitable trading strategy for USD/CHF focuses on understanding how this currency pair behaves in different market conditions. Traders often look at overall trends and market dynamics to guide their approach.

Trend-Following Strategies

Following the prevailing trend helps traders capture profits from sustained movements in USD/CHF.

Breakout Trading

Traders look for key support or resistance levels to anticipate breakout moves and take advantage of sharp price changes.

Safe-Haven Reaction Strategies

During global uncertainty, CHF tends to strengthen. Traders may use this knowledge to hedge positions or exploit volatility.

Risk Management for USD/CHF Traders

Setting stop-loss orders, managing lot sizes, and monitoring exposure help mitigate potential losses in USD/CHF trading.

Is USD/CHF a Good Pair for Beginners?

USD/CHF is often considered by many traders as a commonly followed currency pair in the forex market. Its regular activity and market presence make it a familiar option for those starting to explore currency trading.

Why Do Some Traders Prefer It? 

Moderate volatility and high liquidity make USD/CHF attractive for beginners learning forex trading strategies.

Risk Level

Compared to other major pairs, USD/CHF has manageable risk when traders use proper position sizing and risk management.

Daily Price Ranges

Understanding average daily ranges helps beginners plan trades and avoid overexposure.

Conclusion

The USD/CHF pair offers a unique blend of stability and trading opportunities. By understanding what USD to CHF is, monitoring USD CHF charts and USD CHF signals, and applying disciplined strategies, traders can navigate this currency pair confidently. Platforms like Evest provide the tools, analytics, and educational resources to help both beginners and advanced traders make informed decisions. Using demo accounts initially and gradually transitioning to live trading ensures a safe and effective learning curve.

FAQs

What does USD to CHF mean in currency trading?

USD/CHF represents the exchange rate between the US dollar (USD) and the Swiss franc (CHF), showing how many CHF are needed to buy 1 USD.

How does the USD to CHF exchange rate work?

The exchange rate reflects supply and demand, economic data, interest rates, and global investor sentiment affecting the USD and CHF.

What factors influence the USD CHF price movement?

Factors include US and Swiss economic performance, interest rate policies, safe-haven demand, geopolitical events, and market sentiment.

How can I exchange USD to CHF safely and at the best rate?

Use reliable banks, regulated brokers, or online platforms like Evest that provide competitive spreads and secure transactions.

Is USD CHF a major forex pair?

Yes, USD/CHF is a major currency pair known for liquidity, moderate volatility, and widespread trading interest.