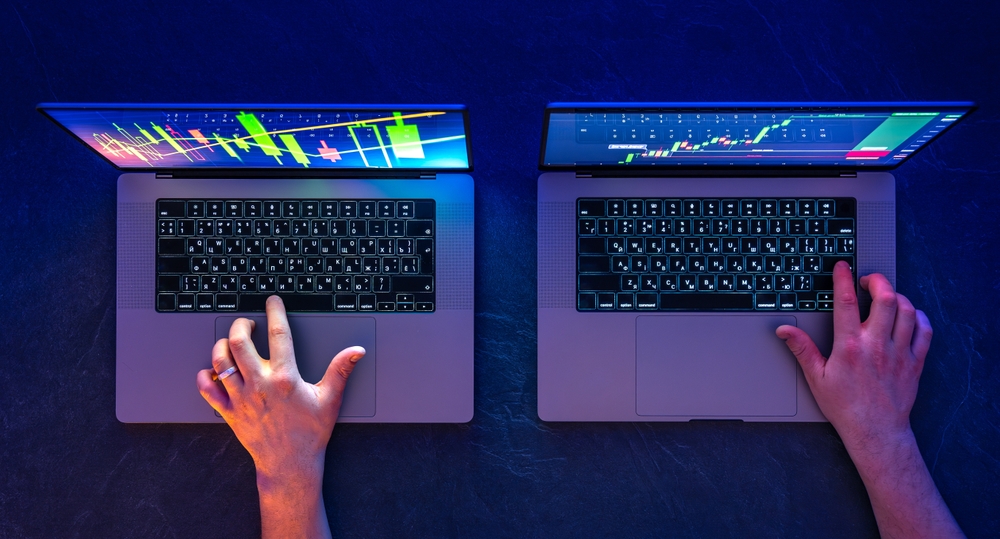
In the fast-paced financial markets, success is no longer defined by luck or intuition alone — data, technology, and precision drive it. The modern trader needs access to online trading tools that empower smarter decisions, faster execution, and deeper analysis.
Whether you’re a beginner learning the ropes or an experienced investor managing a diversified portfolio, online trading tools are essential for tracking price movements, analyzing trends, and managing risk efficiently.
Evest, a globally recognized online trading platform, provides traders with access to cutting-edge trading tools and indicators, designed to simplify complex market movements and enhance their profitability potential. This guide explores everything you need to know about choosing and using the best online trading tools for stocks, forex, crypto, and beyond.
Importance of Online Trading Tools in Modern Trading
In the early days of trading, investors relied heavily on newspapers, phone calls, and manual calculations. But the digital revolution has completely reshaped the trading landscape. Now, online trading tools provide real-time access to market data, helping traders identify profitable opportunities in seconds.
These tools not only streamline market analysis but also help traders make informed decisions. For example, stock trading tools help identify price trends, volume spikes, and potential reversals, while trading tools for crypto track volatility across multiple digital assets in real-time.
For Evest users, integrating these tools within a secure and user-friendly platform allows traders to monitor assets globally — from forex to commodities and indices — all in one place.
How Technology Transformed Trading Strategies?
Technology has revolutionized every aspect of trading. From algorithmic systems that execute thousands of trades in milliseconds to AI-driven analytics predicting market direction, innovation continues to push boundaries.
Traders now use online trading tools to access global trading markets instantly, manage diversified portfolios, and implement complex strategies once reserved for institutional investors.
For instance:
Artificial intelligence helps identify patterns across years of historical data.
Machine learning algorithms predict price movements with higher accuracy.
Automation tools execute trades without human intervention.
Through Evest, traders gain access to a suite of trading tools for forex and multi-asset platforms that bridge human decision-making with advanced digital precision.
Types of Online Trading Tools
Understanding the different categories of online trading tools helps traders choose the right combination for their strategies. Let’s explore the main types.
Charting and Technical Analysis Tools
These are the backbone of every trading setup. Tools like TradingView and MetaTrader allow traders to visualize price movements, draw trendlines, and apply trading tools and indicators like RSI, MACD, and moving averages.
Such visual aids enable traders to interpret market psychology and make quick, informed entries or exits.
Market News and Research Platforms
Financial news is often the first trigger for price volatility. Access to platforms like Bloomberg, Reuters, and Evest’s integrated market updates ensures you never miss major announcements affecting stocks, forex, or cryptocurrencies.
Traders who follow global events can adjust positions ahead of time, using online trading tools that combine both news and analytics.
Stock Screeners and Scanners
Stock trading tools such as Finviz or Yahoo Finance screen thousands of equities to identify the best opportunities based on filters like price, volume, market cap, and technical signals.
For traders on Evest, combining stock screeners with market data allows seamless trade execution when a setup aligns perfectly.
Automated Trading Systems and Bots
Automation is transforming how traders approach the markets. Automated systems follow preset algorithms that buy and sell assets when conditions are met — minimizing emotional decisions.
Platforms like MetaTrader and Evest allow traders to deploy Expert Advisors (EAs) for algorithmic strategies in forex, indices, and commodities.
Portfolio Management Tools
As portfolios grow, managing multiple assets becomes challenging. Tools like Personal Capital or Evest’s built-in account dashboard provide real-time portfolio overviews, profit-loss tracking, and performance metrics — ensuring clarity and balance across all holdings.
Risk Management Calculators
Risk is part of every trading strategy, but it must be controlled. Online trading tools like position size calculators, margin calculators, and stop-loss analyzers help traders determine optimal exposure per trade.
Evest integrates similar calculators directly into the platform, allowing traders to plan trades efficiently and avoid unnecessary losses.
Benefits of Using Online Trading Tools
The advantages of online trading tools extend far beyond convenience — they are essential for survival in competitive markets.
Speed and efficiency: Tools automate processes, reducing manual effort and response time.
Improved accuracy: Algorithms and analytics minimize human error.
Comprehensive insights: Traders can analyze global markets with multiple layers of data.
Accessibility: Even retail traders now have access to institutional-grade information.
Enhanced strategy execution: Combining trading tools for forex with charting and risk control maximizes profitability potential.
Evest users benefit from an integrated ecosystem of online trading tools that simplify execution and enable smarter, faster decisions.
Popular Online Trading Tools in the Market
Overview of Leading Platforms
Some of the best online trading tools available today include:
TradingView: A powerful, browser-based charting platform offering interactive visuals and community-driven insights.
MetaTrader 4 & 5: Industry-standard software for forex and CFD trading with advanced scripting and automation capabilities.
Thinkorswim by TD Ameritrade: Popular for U.S. stock traders, offering high-end analytics, backtesting, and strategy simulations.
Features and Benefits of Each
TradingView – Offers more than 100 customizable indicators, multi-timeframe charts, and real-time alerts. Ideal for both trading tools for crypto and traditional markets.
MetaTrader – Supports Expert Advisors for automated trading strategies, making it ideal for those seeking precision and consistency.
Thinkorswim – Provides comprehensive U.S. market coverage, paper trading accounts, and integration with multiple brokerage services.
Evest competes strongly in this space, offering traders a combination of accessibility, regulation, and cutting-edge technology. Its all-in-one platform provides instant execution, educational content, and market tools fit for beginners and professionals alike.
How to Choose the Right Online Trading Tools?
Selecting the right online trading tools depends on your trading goals, budget, and style. Here’s how to make an informed decision:
Define your trading objectives: Are you trading forex, crypto, or stocks? Each asset requires specialized tools.
Check integration with brokers: Ensure compatibility with regulated platforms like Evest to guarantee smooth execution.
Evaluate cost vs. functionality: Free tools may have limitations, while premium options offer advanced analytics.
Test usability: Choose tools with intuitive designs to avoid confusion during fast market conditions.
Ensure data accuracy: Reliable data feeds are critical for decision-making and risk control.
Evest simplifies this process by offering built-in online trading tools — from market charts to calculators — so traders can access everything in one ecosystem.
Tips for Maximizing the Use of Online Trading Tools
Combine multiple tools: Use both fundamental and technical analysis to confirm trade ideas.
Backtest strategies: Before committing real funds, use historical data to evaluate potential performance.
Leverage demo accounts: Evest offers demo accounts to help traders practice using online trading tools without financial risk.
Use alerts and notifications: Automate price alerts to stay informed about key market movements.
Avoid overreliance: While tools are valuable, human judgment remains essential in unpredictable markets.
Optimize your workspace: Set up your charts and dashboards for clarity and quick decision-making.
With these practices, traders can unlock the full power of online trading tools while minimizing potential errors.
Evest Services
Evest provides comprehensive trading services that cater to both beginners and professionals. Its platform combines powerful tools, real-time data, and expert support for an enhanced trading experience.
Commission-Free Stock Trading
Evest allows clients to trade global stocks with zero commission, making it an attractive choice for investors who want to access international markets with minimum costs.
CFD Trading
The platform provides access to a wide range of financial assets through Contracts for Difference (CFDs), including stocks, forex, indices, commodities, and cryptocurrencies. This gives traders great flexibility to diversify their strategies.
WebTrader Platform
Evest offers a WebTrader platform that works directly from the browser without the need to download extra software. It features a user-friendly interface with real-time charts and analysis tools to help investors make better trading decisions.
Copy Trading
With the copy trading service, beginners or passive investors can automatically copy the trades of professional traders. This allows users to benefit from the experience of experts and potentially generate steady profits.
Demo Account
Evest provides a free demo trading account where traders can practice with virtual funds. This service is especially useful for beginners to learn trading basics and test strategies without risking real money.
Islamic Trading Accounts
Evest offers Islamic (Swap-Free) accounts that are free from interest charges, making them compliant with Shariah law and suitable for Muslim traders.
Smart Analytics Tool (Evest Analytics)
The platform integrates AI-powered analytics tools that deliver accurate market insights and instant alerts, helping traders to identify investment opportunities at the right time.
Mobile Trading App
Evest provides a modern mobile application for iOS and Android, enabling users to trade anywhere, anytime, with the same tools and features available on the web platform.
Multiple Deposit & Withdrawal Options
Evest supports various payment methods for deposits and withdrawals, including:
Credit and debit cards
E-wallets
Bank transfers
This ensures flexible and convenient financial transactions for traders worldwide.
In Conclusion
The future of financial success lies in mastering technology, and online trading tools are at the core of that evolution. Whether you’re investing in forex, crypto, or stocks, having access to reliable trading tools and indicators significantly enhances your performance and decision-making.
Evest offers a seamless and secure environment where traders can use advanced charting systems, automated bots, portfolio managers, and risk calculators — all in one place. By combining expertise with the right digital tools, traders can gain an edge in today’s volatile markets.
If you’re serious about achieving consistent results, now is the time to explore Evest’s platform and unlock the full potential of online trading tools built for the modern investor.
FAQs
What is the best online trading tool?
It depends on your trading style. For charting, TradingView and MetaTrader are highly recommended. However, Evest offers a complete ecosystem combining multiple online trading tools in one platform.
Can I make $1000 per day from trading?
Yes, but it requires significant experience, capital, and discipline. Online trading tools can enhance your strategy, but profits depend on skill and risk management.
Can you make $200 a day trading?
With a consistent strategy and proper tools, making $200 daily is realistic for intermediate traders, especially using stock trading tools or trading tools for forex on Evest.
What tools to use for trading?
Essential tools include charting platforms, news feeds, portfolio trackers, and risk management calculators — all available on Evest.
Is trading gambling?
No, trading relies on analysis, research, and data-driven decision-making. Proper use of online trading tools helps eliminate emotional bias, making it a structured and strategic activity.
In the fast-paced world of online trading, scalping trading has become one of the most dynamic and fast-moving strategies used by traders seeking consistent, small profits throughout the day. Unlike long-term investment strategies that rely on broader market trends, scalpers enter and exit trades quickly — sometimes within seconds or minutes — to capture minor price fluctuations.
At Evest, traders can explore multiple financial markets through a secure and regulated platform, ideal for executing scalping trading strategies with speed and accuracy. Whether you’re a beginner or an experienced trader, understanding how scalping trading works, its benefits, and risks is essential before you start applying it in live trading markets.
In this comprehensive guide, we’ll dive into the definition of scalping, how it differs from other trading styles, and step-by-step rules and tips for setting up your scalping trading account with Evest.
Definition of Scalping Trading
Scalping trading is a short-term trading technique that focuses on profiting from small price movements in the market. Traders who adopt this approach — called scalpers — aim to make numerous trades in a single day, each yielding a small profit.
The main idea behind scalping trading is simple: capitalise on market inefficiencies and tiny fluctuations that occur frequently throughout the trading day. Scalping requires high focus, quick decision-making, and access to a reliable platform like Evest that provides instant order execution and low spreads.
While traditional traders analyse broader trends and hold positions for hours or days, scalpers rely on very short timeframes — sometimes as little as 1 to 5 minutes.
This approach appeals to those who prefer an active trading lifestyle and immediate results rather than waiting for long-term movements.
How Does It Differ from Other Trading Styles?
To understand the uniqueness of scalping trading, it’s important to compare it to other common trading approaches, especially swing and position trading.
In scalping trading, positions are opened and closed very quickly, often within minutes. The focus is on liquidity and high trade frequency. Meanwhile, swing traders hold positions for days or even weeks, targeting larger market movements. Position traders, on the other hand, hold trades for months or longer, relying on fundamental analysis.
The main difference between scalping trading vs swing trading is time horizon and profit target. Scalping aims for small, consistent profits, while swing trading seeks larger but less frequent gains.
How Scalping Trading Works?
Scalping trading is a fast-paced strategy focused on taking advantage of small price movements. It’s designed for traders who prefer quick decisions and consistent action in the market.
Small Price Movements and Quick Trades
The foundation of scalping trading lies in exploiting minor market fluctuations. For example, a trader might buy an asset at $100.00 and sell it at $100.10 — making just $0.10 per share, but repeating this dozens or hundreds of times per session.
Because the profit margin per trade is small, scalping trading relies on precision and volume. Successful scalpers use platforms like Evest that ensure low-latency execution and minimal slippage.
Timeframes Commonly Used in Scalping
Scalping usually takes place on very short timeframes such as 1-minute, 3-minute, or 5-minute charts. These intervals help traders react to short-term market movements instantly. Evest provides advanced charting tools and real-time data suitable for these fast-paced trades.
Role of Liquidity and Volatility
High liquidity markets are ideal for scalping trading because they allow traders to enter and exit quickly without major price slippage. Assets like forex pairs, indices, and futures contracts offer sufficient liquidity.
Volatility is equally important — too little means fewer opportunities, while too much increases risk. Striking a balance is key.
Benefits of Scalping Trading
Scalping trading offers traders the opportunity to capture frequent profits from small market movements. It’s ideal for those seeking consistent results through active, short-term trading.
Quick Profits from Small Moves
One of the biggest attractions of scalping trading is the ability to generate profits within minutes. Traders don’t need to wait for long-term setups; instead, they make small gains multiple times a day.
High Number of Trading Opportunities
Because scalping trading works on short timeframes, traders can find numerous opportunities in a single session. Volatile markets like forex and futures can generate dozens of signals daily.
Lower Exposure to Market Risk
Shorter holding times mean less exposure to overnight market changes or unexpected news. This makes scalping trading for beginners appealing, as the risks can be limited to the short periods of active trading.
Risks of Scalping Trading
While the potential for quick profits is appealing, scalping trading also comes with specific risks.
Frequent trading can lead to high transaction costs if spreads and commissions are not minimised. Moreover, emotional stress from constant decision-making can impact judgment.
Markets can move suddenly, and even a few seconds of delay can turn a profitable trade into a loss. This is why using a reliable broker like Evest is crucial — it ensures speed, accuracy, and transparency.
Popular Scalping Trading Strategies
Scalping trading strategies focus on quick entries and exits to capture minor price shifts. Traders use these methods to maximise efficiency and consistency in fast-moving markets.
Moving Average Scalping
This is one of the most widely used scalping trading strategies. Traders use short-term moving averages, such as the 9 EMA and 21 EMA, to identify quick momentum shifts and place buy or sell orders accordingly.
Bollinger Bands Scalping
Bollinger Bands help detect overbought and oversold conditions. When prices touch the lower band, a trader may buy, expecting a short bounce; when they touch the upper band, they may sell.
Price Action Scalping
This approach relies purely on price behaviour — candlestick patterns, support/resistance levels, and order flow. No indicators are used, making decisions faster.
Order Flow and Volume-Based Scalping
Professional scalpers analyse live order books and trading volumes to anticipate short-term price moves. Platforms like Evest provide access to detailed volume data and advanced charting for this method.
Best Markets for Scalping Trading
Scalping trading performs best in markets with high liquidity and volatility. These conditions allow traders to enter and exit positions quickly while taking advantage of small price movements.
Forex Scalping
Scalping trading in forex is the most common form because forex markets offer high liquidity and 24-hour access. Major currency pairs like EUR/USD and GBP/USD are ideal for quick, small trades.
Stock Scalping
Stock markets also provide opportunities for scalpers who trade during high-volume sessions. Blue-chip stocks and ETFs with tight spreads are commonly preferred.
Futures and Indices Scalping
Scalping trading futures involves trading contracts on commodities or indices like the S&P 500. These markets can be highly liquid and responsive, making them perfect for short-term trades.
Cryptocurrency Scalping
Crypto markets are known for volatility, which creates multiple short-term opportunities for scalpers who can react quickly.
Tips for Successful Scalping Trading
Choose a fast, regulated broker — Platforms like Evest provide instant execution and security.
Use reliable indicators — Combining moving averages, Bollinger Bands, and RSI can refine trade entries.
Keep emotions in check — Avoid overtrading or revenge trading after a loss.
Maintain discipline — Stick to a clear scalping trading strategy and stop-loss levels.
Use a demo account first — Test your skills in a demo futures trading or forex environment before trading live.
Track performance — Review trade history regularly to identify patterns of success or failure.
Evest Services
Evest offers a range of financial services designed to support traders of all levels. From advanced trading tools to educational resources, it provides everything needed for a seamless trading experience.
Commission-Free Stock Trading
Evest allows clients in stocks trading with zero commission, making it an attractive choice for investors who want to access international markets with minimum costs.
CFD Trading
The platform provides access to a wide range of financial assets through Contracts for Difference (CFDs), including stocks, forex, indices, commodities, and cryptocurrencies. This gives traders great flexibility to diversify their strategies.
WebTrader Platform
Evest offers a WebTrader platform that works directly from the browser without the need to download extra software. It features a user-friendly interface with real-time charts and Markets analysis tools to help investors make better trading decisions.
Copy Trading
With the copy trading service, beginners or passive investors can automatically copy the trades of professional traders. This allows users to benefit from the experience of experts and potentially generate steady profits.
Demo Account
Evest provides a free demo account where traders can practice with virtual funds. This service is especially useful for beginners to learn trading basics and test strategies without risking real money.
Islamic Trading Accounts
Evest offers Islamic (Swap-Free) accounts that are free from interest charges, making them compliant with Shariah law and suitable for Muslim traders.
Smart Analytics Tool (Evest Analytics)
The platform integrates AI-powered analytics tools that deliver accurate market insights and instant alerts, helping traders to identify investment opportunities at the right time.
Mobile Trading App
Evest provides a modern mobile application for iOS and Android, enabling users to trade anywhere, anytime, with the same tools and features available on the web platform.
Multiple Deposit & Withdrawal Options
Evest supports various payment methods for deposits and withdrawals, including:
Credit and debit cards
E-wallets
Bank transfers
This ensures flexible and convenient financial transactions for traders worldwide.
In Conclusion
Scalping trading is a fast, exciting, and potentially profitable trading style that rewards discipline, speed, and focus. With the right setup, strategies, and tools, it can become a consistent source of income for active traders.
Platforms like Evest empower traders to implement scalping trading strategies efficiently, offering access to forex, futures, stocks, and cryptocurrencies — all through a single, easy-to-use interface.
If you’re new to trading, it’s crucial to start with a demo account, practice scalping trading for beginners, and gradually move to live trading once you’ve developed confidence and consistency.
FAQs
What is scalping in trading?
It refers to making multiple quick trades to capture small price changes throughout the day.
Is scalping trading profitable?
Yes, it can be profitable with proper risk management, discipline, and a reliable broker like Evest.
Is scalping good for beginners?
Beginners can start with a demo account to understand speed and execution before risking real capital.
How do I start scalping?
Open a live or demo account with Evest, set up your charts on short timeframes, and use simple indicators for quick entries.
Futures trading allows traders to speculate on or hedge against future price movements in markets such as commodities, indices, and currencies. At Evest, futures trading does not require a separate futures trading account; eligible futures instruments can be accessed through a regular trading account, subject to platform availability and trading conditions. Platforms like Evest have made futures trading more accessible than ever before by providing intuitive interfaces, real-time market data, and competitive tools for all trading levels. Whether you’re a beginner or a seasoned professional, understanding how a futures trading account works is essential for maximizing your trading opportunities and managing your risks efficiently.
This Futures Trading Account Guide explains how futures trading accounts generally work, how futures contracts differ from CFDs, the role of margin and leverage, the main benefits and risks, and what Evest users should know before accessing futures through their trading account. Whether you’re seeking to start with demo futures trading or are ready for live markets, this comprehensive guide will help you make informed decisions and enhance your trading journey.
What is a Futures Trading Account?
A futures trading account is a brokerage account that provides access to futures contracts—standardized agreements to buy or sell an underlying asset at a specified price and future date. Account structures vary between brokers, and some platforms may provide futures access through a general trading account rather than a separate futures-specific account. These contracts are standardized agreements to buy or sell an underlying asset at a predetermined price and date in the future. Common assets include commodities like oil, gold, and wheat, as well as financial instruments like indices, currencies, and bonds.
Depending on the broker and the specific futures market, traders may take long or short positions and use margin to gain exposure to a larger contract value. Margin can increase market exposure, but it can also magnify losses, making position sizing and risk management essential. However, leverage can also increase risk, making it essential to understand how futures trading works before diving in.
Evest states that there is no separate futures trading account on its platform.Traders can access available futures instruments through their regular Evest trading account after completing registration, verification, and funding requirements.
Its platform is tailored for both beginners and professionals, offering market analysis tools, educational materials, and a seamless interface to manage trades efficiently.
In essence, a futures trading account acts as your gateway to global markets, enabling you to trade futures contracts with flexibility, precision, and control.
Why Do Traders Use Futures Accounts?
Traders use futures contracts mainly for two purposes: hedging existing exposure and speculating on future price movements. Futures may also provide access to different asset classes, but liquidity, contract specifications, and risk can vary significantly between markets. The most common motivations include:
Hedging: Many investors use futures contracts trading to hedge against potential price fluctuations in assets they already own. For example, a gold producer may sell futures contracts to lock in a favorable price and protect against a future decline in gold prices.
Speculation: Active traders often use futures trading accounts to speculate on short-term price movements in commodities or indices. Because futures are traded on margin, traders may gain substantial market exposure relative to the capital committed. However, the same leverage can magnify losses, so potential return should never be discussed without the corresponding downside risk.
Diversification: Futures markets cover a wide range of assets, allowing traders to diversify beyond stocks and bonds. With access to commodities, currencies, and indices, a futures trading account broadens investment horizons.
Liquidity: Many major futures contracts are highly liquid, but liquidity varies by contract, exchange, and trading session. Lower-volume contracts may experience wider spreads or greater slippage, so traders should evaluate the specific futures market rather than assuming equal liquidity across all contracts.
Transparency and Regulation: Futures markets are highly regulated and transparent, providing traders with a secure environment.
Evest offers traders a reliable and user-friendly futures trading account to engage in these markets with confidence and access to advanced trading tools.
How a Futures Trading Account Works?
Understanding how futures trading works requires knowing the contract size, expiry date, margin requirement, settlement structure, and the effect of price movements on the position. These factors distinguish futures from many other trading products.
Contracts for Difference Explained
Futures and CFDs are different products. Futures contracts are standardized contracts with defined expiry dates and contract specifications, while CFDs are typically agreements between a trader and a broker based on the price movement of an underlying asset. The distinction should be understood before choosing either product. Each futures contract has an expiry date and a standardized size, ensuring consistency across exchanges.
Long vs Short Positions
Futures traders can generally take a long position when they expect the contract price to rise or a short position when they expect it to fall. Because futures positions are leveraged through margin, both directions involve the risk of significant losses if the market moves against the trade. This dual-direction trading is one reason futures markets are popular among investors.
Leverage and Margin Trading
Leverage is a defining feature of a futures trading account. It allows traders to control large positions with relatively small deposits (margin). While leverage can multiply profits, it also increases the risk of losses, especially during volatile market conditions.
online trading platforms like Evest provide detailed tutorials and risk management tools for users to understand and leverage effectively, and minimize potential losses while maximizing opportunities.
Steps to Open a Futures Trading Account with Evest
Evest does not require users to open a separate futures trading account. According to Evest’s current support information, users register for a regular trading account, complete verification, fund the account, and then access futures instruments that are available on the platform.
Choosing a Regulated Broker
Before trading futures, traders should review the broker’s regulatory status, available futures instruments, margin requirements, fees, platform reliability, and risk disclosures. Regulatory status should be described using the broker’s verified licenses and jurisdictions rather than broad claims such as “ensuring safety..
Application and Documentation Process
After choosing Evest, traders complete an online registration form and provide verification documents like ID and proof of address. This step ensures compliance with global financial regulations.
Funding Your Account
Once the account is verified, traders can deposit funds using various payment methods supported by Evest, including bank transfers and digital wallets. Before trading live, users can also start with demo futures trading to practice strategies without financial risk.
By following these steps, traders can quickly set up their futures trading account and start exploring the exciting world of futures markets.
Types of Futures Trading Accounts
Futures account structures vary by broker and jurisdiction. Some futures brokers may support individual, joint, institutional, or managed account structures. However, these categories should not be presented as Evest account types unless Evest specifically confirms that they are available. Each offers unique features tailored to investors’ needs.
Individual vs Joint Accounts
Individual and joint futures accounts may be available through some futures brokers, but availability depends on the broker and jurisdiction. For an Evest-focused article, this section should only remain if these account structures are actually supported by Evest.
Institutional Accounts
Institutional futures trading accounts are designed for corporations and fund managers dealing in high volumes. They often come with additional support and advanced analytics.
Managed Futures Accounts
Managed futures accounts are a separate account structure offered by some financial institutions or futures specialists. Do not state that Evest supports managed futures accounts unless this is confirmed by Evest’s current product documentation, providing flexibility for diverse trading needs.
Benefits of a Futures Trading Account
Futures trading can provide several potential advantages, including access to different markets, long and short positioning, and opportunities for hedging or speculation. These advantages should always be evaluated alongside leverage, margin requirements, expiry dates, and market volatility.
Access to Multiple Markets (Commodities, Indices, Currencies)
A single futures trading account provides access to a wide array of markets, including commodities, indices, and forex. This makes it easier to diversify your portfolio and seize global opportunities.
Liquidity and Transparency
Futures markets are among the most liquid in the world. With high trading volume, investors can execute large trades efficiently with minimal spreads.
Hedging and Speculation Opportunities
Through futures contracts trading, investors can hedge existing positions or speculate on price changes. This dual-purpose feature is what makes futures appealing to all kinds of traders.
Evest enhances these benefits by offering powerful tools, user-friendly charts, and educational resources that empower traders to make informed decisions.
Risks of Futures Trading Accounts
Futures trading involves significant risk because contract values can be large relative to the margin deposited. Key risks include leverage, market volatility, margin calls, liquidity differences, expiry management, and the possibility of losses exceeding the trader’s expected risk.
High Leverage Risks
Leverage amplifies both profits and losses. Even small market movements can lead to significant gains or losses.
Market Volatility
Futures prices can fluctuate rapidly, especially in commodities or indices influenced by global events.
Margin Calls and Losses
If account equity falls below the required margin level, additional funds may be required or positions may be reduced or closed depending on the broker’s margin policy. Traders should understand initial margin, maintenance margin, and liquidation rules before opening a futures position.
Regulatory Considerations
Ensure your broker is fully regulated, like Evest, to protect your funds and trading activities.
Understanding these risks is crucial before opening a futures trading account, and Evest offers guidance to help traders navigate them wisely.
Futures Trading Strategies for Account Holders
Experienced traders use several trading strategies to maximize gains from their futures trading accounts:
Day Trading: Involves short-term positions opened and closed within the same day.
Swing Trading: Focuses on capturing medium-term price swings using technical analysis.
Spread Trading: Involves taking offsetting positions in related contracts to minimize risk.
Hedging: Protects existing investments from adverse price movements.
Each strategy can be practiced on demo futures trading accounts before implementing them live on platforms like Evest, which offers analytical tools and market insights to refine strategies.
What is a futures trading account?
A futures trading account is a brokerage account that allows investors to trade standardized contracts based on future prices of assets like commodities, indices, or currencies.
What is the best trading account for futures?
The best futures trading platform depends on reliability, low fees, and strong analytics — all of which Evest offers.
Do you need $25,000 to trade futures?
Not necessarily. The required amount depends on margin requirements and your broker’s policies. Evest allows traders to start with flexible amounts.
Is CFD the same as futures?
No. CFDs are contracts with the broker, while futures are standardized exchange-traded contracts.
Can I trade futures with a funded account?
Yes. Once you fund your futures trading account, you can access multiple markets and start trading immediately.
Contracts for Difference, commonly known as CFDs, allow traders to speculate on the price movement of financial markets without purchasing the underlying asset itself.
A CFD Trading Guide can provide exposure to markets such as currencies, shares, stock indices, commodities and, depending on the provider and jurisdiction, cryptocurrencies. Traders can take positions on both rising and falling prices, often using leverage.
This guide explains how CFD trading works, how profits and losses are calculated, what leverage and margin mean, what trading costs to consider, how CFDs differ from other financial instruments, and which risks traders should understand before using them.
Important: CFD rules, leverage limits, investor protections and product availability differ between countries and regulatory jurisdictions.
What Is CFD Trading?
CFD stands for Contract for Difference. It is a derivative contract between a trader and a CFD provider in which the parties exchange the difference between an asset’s price when the position is opened and its price when the position is closed.
The trader normally does not own the underlying asset. For example, opening a CFD position linked to a company’s share price does not normally make the trader a shareholder in that company.
Instead, the CFD tracks the movement of the underlying market. If the market moves in the direction of the trade, the position may generate a profit.
If it moves in the opposite direction, the position generates a loss. Trading costs must also be taken into account.
CFD Trading Guide in 60 Seconds
The basic CFD process is:
Choose an underlying market.
Decide whether you expect its price to rise or fall.
Choose the size of the position.
Deposit the margin required to open the leveraged position.
Open a long or short CFD.
The position gains or loses value as the underlying market moves.
Close the position.
The final profit or loss is calculated from the price difference, position size and applicable trading costs.
CFDs therefore give traders price exposure rather than ownership. That distinction affects voting rights, dividends, costs, regulation and risk.
How Does CFD Trading Work?
Suppose a share is trading at $100. A trader expects its price to increase and opens a CFD equivalent to 100 shares. The notional value of the position is:
100 × $100 = $10,000
If the price rises to $104 and the position is closed, the gross price movement is:
$4 × 100 = $400
Before calling that $400 a profit, however, the trader must account for relevant costs such as the spread, commissions and financing charges. If the price instead falls to $96, the price movement produces a gross loss of:
$4 × 100 = $400
The important point is that the trader’s exposure is based on the full $10,000 position, even when only a fraction of that amount was deposited as margin. That is where leverage changes the risk.
Long and Short CFD Positions
CFDs generally allow traders to speculate in either direction.
Going Long
A trader opens a long CFD position when they expect the underlying market to rise.
Buy lower → Close higher → Potential profit.
If the market falls instead, the position loses money.
Going Short
A trader opens a short CFD position when they expect the underlying market to fall.
Sell higher → Close lower → Potential profit.
If the market rises instead, the position loses money.
Being able to short a market easily is one of the characteristics that distinguishes CFDs from simply purchasing many underlying investments.
Short selling, however, does not remove risk. A rapidly rising market can create substantial losses on a short CFD position.
What Is Leverage in CFD Trading?
Leverage allows a trader to control a position whose market exposure is greater than the amount initially deposited. For example, with leverage of 10:1:
$1,000 of margin may provide $10,000 of market exposure.
This does not mean the trader is only exposed to movements on $1,000. Profit and loss are normally determined by the larger position.
Why Leverage Matters?
Imagine two traders each have $1,000.
One invests $1,000 directly.
Another uses the $1,000 as margin to control a $10,000 CFD position.
If the underlying market moves by 5%, the direct investment moves by approximately $50.
The $10,000 exposure moves by approximately $500.
Leverage has magnified the impact of the market movement.
It works in both directions.
For this reason, leverage should primarily be understood as a risk amplifier, not simply a way to increase potential profits.
What Is Margin?
Margin is the amount that must be available in a trading account to open or maintain a leveraged CFD position. If a $10,000 CFD position requires 10% margin, the initial margin is:
$10,000 × 10% = $1,000
Margin is not the maximum amount the position can lose. It is the capital required to support the leveraged exposure.
Margin Close-Out
If losses reduce the account’s available funds sufficiently, the provider may begin closing positions according to the applicable margin close-out rules.
This can happen automatically. The exact calculation and threshold depend on the provider and regulatory regime. Traders therefore need to understand both:
Initial margin requirements
Margin close-out requirements
before opening leveraged positions.
How Are CFD Profits and Losses Calculated?
A simplified calculation is:
Price movement × Position size = Gross P&L
For a long position:
Closing price − Opening price
For a short position:
Opening price − Closing price
That result is then multiplied by the relevant contract or position size.
Actual trading results also need to account for applicable charges and adjustments.
Example
A trader buys 50 share CFDs at $200.
The position size is:
50 × $200 = $10,000
The price later increases to $206.
Gross movement:
$6 × 50 = $300
The actual net result would then depend on costs such as spread, commissions and financing.
This is why analysing CFD returns only from entry and exit prices can be misleading.
What Does It Cost to Trade CFDs?
CFD trading can involve several different types of costs.
Spread: The spread is the difference between a market’s quoted buy and sell prices. A position can therefore begin with an immediate trading-cost disadvantage equal to the relevant spread.
Commission: Some CFD markets may include a separate transaction commission. This is particularly common with certain share CFD pricing models.
Overnight Financing: Leveraged CFD positions held overnight may incur financing or funding charges. The calculation varies by instrument and provider. For positions held for multiple days or weeks, financing costs can become an important part of the final result.
Currency Conversion: If the instrument is denominated in a currency different from the account’s base currency, currency-conversion charges may apply.
Other Adjustments: Depending on the product and provider, traders may also encounter dividend adjustments, market-data charges or other account-related costs.
The relevant product specifications and fee schedule should therefore be reviewed before trading.
Which Markets Can Be Traded Using CFDs?
Available markets depend on the provider and jurisdiction. Common categories include:
Forex CFDs
CFDs can provide exposure to currency pairs such as EUR/USD or GBP/USD. Foreign exchange is frequently traded using leveraged OTC products, although the precise legal structure of forex trading varies between providers and jurisdictions.
Share CFDs
Share CFDs track the price movement of individual listed companies. Unlike owning ordinary shares, the CFD trader normally does not become the legal shareholder.
Index CFDs
Index CFDs provide exposure to the movement of an equity index rather than an individual company. Examples can include indices tracking major US, European or Asian equity markets.
Commodity CFDs
CFDs can track markets such as:
Gold
Silver
Crude oil
Natural gas
Agricultural commodities
Contract specifications vary between instruments.
Cryptocurrency CFDs
Where permitted, some providers offer CFDs referencing crypto-assets. The trader gains exposure to the price movement without necessarily owning or holding the cryptocurrency itself. Availability and leverage can be heavily restricted depending on local regulation.
CFDs vs Owning the Underlying Asset
Buying an asset and trading a CFD linked to that asset are not the same thing.
Ownership: When buying ordinary shares, an investor generally owns the shares. With a share CFD, the trader normally owns a derivative contract rather than the shares themselves.
Shareholder Rights: A share CFD does not normally provide shareholder voting rights.
Leverage: Direct investments may be purchased without leverage. CFDs are frequently leveraged.
Short Exposure: Opening a short CFD can often be more straightforward than arranging traditional short selling.
Holding Costs: Leveraged CFDs held overnight may generate financing costs, making them structurally different from unleveraged long-term ownership.
Risk Profile: Because leverage magnifies price movements, CFDs can create much faster changes in account equity. CFDs should therefore not be treated as interchangeable with owning the underlying asset.
CFD Trading Risks
Understanding CFD risk requires more than saying that markets are volatile. There are several separate risk layers.
1. Leverage Risk
Leverage magnifies both favourable and unfavourable market movements. A relatively small move in the underlying market can create a significant change in the value of the trader’s account.
2. Market Risk
Prices may move rapidly because of:
Economic data
Interest-rate decisions
Company announcements
Political events
Geopolitical developments
Unexpected news
Changes in liquidity
3. Gap Risk
Markets do not always move smoothly from one price to another. A market may jump from one level to another, particularly after major news or during reopening periods. A normal stop-loss order may therefore be executed at a different price from the level originally requested.
4. Liquidity and Slippage Risk
During volatile or illiquid conditions, execution may occur at a different price than expected. This is known as slippage.
5. Financing Risk
A trade can be directionally correct but still become less profitable if substantial financing costs accumulate over time.
6. Counterparty Risk
Most retail CFDs are OTC derivative contracts. The trader is therefore entering into a contractual relationship with the CFD provider. Understanding who the regulated entity is, where client money is held and which regulatory protections apply is important.
7. Operational Risk
Platform problems, connectivity failures, incorrect order sizes and execution errors can affect trading outcomes.
8. Behavioural Risk
Leverage can also amplify poor decision-making. Common behavioural problems include:
Overtrading
Revenge trading
Increasing position size after losses
Ignoring predetermined risk limits
Trading products that are not understood
CFD Regulation and Investor Protection
CFD regulation differs substantially by country. The regulatory entity serving an account can matter as much as the brand name displayed on a website.
European Union
European retail CFD protections include limits on leverage, margin close-out requirements, negative balance protection, restrictions on trading incentives and prescribed risk warnings.
Leverage limits generally vary by asset class, with higher permitted leverage for some major currency pairs and substantially lower leverage for more volatile assets such as cryptocurrencies.
In February 2026, ESMA also reminded firms that certain leveraged products marketed as perpetual futures or perpetual contracts may fall within existing CFD product-intervention rules when their characteristics meet the definition of a CFD.
United Kingdom
UK retail CFD rules similarly include leverage restrictions, margin close-out requirements, negative balance protection and mandatory provider-specific risk warnings.
Australia
Australia also restricts retail CFD leverage and applies measures including margin close-out protections and negative balance protection. ASIC’s CFD product-intervention measures are currently scheduled to remain in force until May 2027.
Why Regulation Matters?
Regulation can affect:
Maximum leverage
Client-money arrangements
Risk disclosures
Negative balance protection
Complaint procedures
Marketing practices
Eligibility for certain products
Classification as a retail or professional client
A trader should therefore identify the specific legal entity and regulator associated with an account rather than relying only on the trading platform’s brand name.
What Is Negative Balance Protection?
Negative balance protection is designed to prevent eligible retail clients from losing more than the funds dedicated to their CFD trading account under applicable regulatory rules.
Within the relevant EU rules, retail CFD liability is limited to funds in the CFD account. That protection should not be confused with protection against losses.
A trader can still lose the funds committed to the CFD account. The protection concerns losses exceeding those funds. It also may not apply equally to every trader, product, account classification or jurisdiction.
Stop-Loss Orders and Risk Management
A stop-loss order instructs the trading system to close a position when a specified market condition is reached. Stops can help define risk, but they do not guarantee execution at the requested price in every market condition.
During gaps or fast markets, execution can occur at the next available price. Where available, guaranteed stop-loss products may operate differently and may involve additional terms or costs. Risk management also includes decisions about:
Position size
Maximum exposure
Correlated positions
Leverage
Account-level risk
Event risk
Simply adding a stop-loss does not make an oversized leveraged position low-risk.
Common CFD Trading Strategies
A strategy describes how a trader identifies, enters, manages and exits trades. It does not guarantee profitability.
Day Trading: Positions are normally opened and closed within the same trading day. This can reduce overnight exposure but may increase trading frequency and transaction costs.
Swing Trading: Positions may be held for several days or weeks while attempting to capture larger market movements. Financing costs become particularly important for leveraged positions held over time.
Trend Trading: Traders attempt to participate in sustained upward or downward market trends.
Range Trading: Traders look for markets repeatedly moving between identifiable support and resistance areas.
Scalping: Scalping involves a high number of very short-duration trades targeting relatively small movements. Execution quality, spreads and trading costs can have a particularly large effect on this approach.
Hedging: Some market participants use CFDs to offset part of an existing market exposure. A hedge can reduce a particular exposure but can also introduce additional costs and risks. It should not be assumed to remove risk completely.
CFD Trading vs Futures
Both CFDs and futures are derivatives, but their structure differs.
Futures contracts are generally standardized contracts traded on regulated exchanges with defined specifications and expiration arrangements.
Retail CFDs are generally OTC contracts provided by a CFD issuer.
Differences can include:
Trading venue
Contract size
Expiration
Pricing
Counterparty structure
Margin system
Regulation
Trading costs
Neither structure is automatically better. They solve different trading needs and create different risks.
CFD Trading vs Options
An option gives its buyer a contractual right, but not usually an obligation, to buy or sell an underlying asset under specified conditions.
A CFD tracks the price movement of an underlying reference and generates profit or loss from that price difference.
Options also involve factors such as:
Strike price
Expiration
Implied volatility
Time decay
Their payoff structure is therefore fundamentally different from that of CFDs.
How to Evaluate a CFD Broker?
Choosing a CFD provider should begin with regulation and product structure, not bonuses or maximum leverage. Important questions include:
Which legal entity will hold the account?
Which regulator supervises that entity?
Is the client classified as retail or professional?
Which investor protections apply?
What are the leverage limits?
How does margin close-out work?
Is negative balance protection available?
What spreads and commissions apply?
What are the overnight financing rates?
How are orders executed?
How is client money handled?
What is the complaint process?
Which markets are available?
Are important product specifications clearly disclosed?
A regulated provider does not remove trading risk, but understanding the regulatory framework reduces uncertainty around the contractual relationship.
Are CFDs Suitable for Beginners?
CFDs can be difficult for beginners because several concepts operate at the same time:
Someone who does not yet understand the difference between deposit size and total market exposure is not ready to evaluate the risk of a leveraged CFD position.
A demo environment can be useful for understanding platform mechanics, but simulated performance should not be assumed to predict live trading results. Real-money trading introduces factors such as emotional pressure, execution conditions and actual financial loss.
Are CFDs Suitable for Long-Term Investing?
CFDs can technically remain open for extended periods where product terms allow it. That does not necessarily make them an efficient substitute for owning an asset long term.
Overnight financing costs can accumulate on leveraged positions. Investors seeking long-term economic exposure should therefore compare:
Direct ownership
ETFs
Futures
Options
CFDs
based on their objective, expected holding period, cost structure andrisk tolerance.
Why Do Many Retail CFD Traders Lose Money?
Regulators have repeatedly raised concerns about retail CFD losses. Historic ESMA analysis found that approximately 74%–89% of retail CFD accounts lost money across analysed EU jurisdictions.
The reasons are not limited to poor market predictions. They can include:
Excessive leverage
High trading frequency
Trading costs
Weak risk management
Poor position sizing
Holding losing trades
Behavioural biases
Attempting to recover losses quickly
Trading complex products without understanding them
Leverage makes mistakes more expensive and gives traders less time to recover from poor decisions.
Common CFD Trading Mistakes
Using the Maximum Available Leverage: Available leverage should not be treated as recommended leverage.
Confusing Margin With Maximum Loss: Margin determines the capital required to support a position. It does not represent the total market exposure.
Ignoring Trading Costs: Spread, commission and financing can materially change the economics of a trade.
Trading Without Understanding Contract Size: A trader should understand the monetary impact of every unit of price movement before entering a position.
Choosing a Provider Based on Bonuses: Marketing incentives say little about execution quality, regulation or product suitability.
Treating a Demo Account as Proof of Profitability: Simulation helps users learn platform mechanics. It cannot reproduce every psychological and market condition associated with live trading.
Focusing Only on Entry Signals: A complete trade also needs a plan for position sizing, invalidation, exit and account risk.
CFD Trading Glossary
Ask Price: The price at which a trader can generally buy.
Bid Price: The price at which a trader can generally sell.
CFD: Contract for Difference.
Contract Size: The quantity represented by a position.
Counterparty: The other party to a financial contract.
Leverage: The relationship between market exposure and the capital required to support it.
Long: A position that generally benefits when the underlying price rises.
Margin: Funds required to open or maintain a leveraged position.
Margin Close-Out: Automatic position closure triggered when account equity falls below specified requirements.
Notional Value: The full market value represented by a leveraged position.
Short: A position that generally benefits when the underlying price falls.
Slippage: The difference between an expected execution price and the price at which a transaction is actually executed.
Spread: The difference between bid and ask prices.
Stop-Loss: An order designed to close a position when specified market conditions are reached.
Underlying Asset: The market or reference value on which a derivative is based.
FAQs
What does CFD stand for?
CFD stands for Contract for Difference. It is a derivative that allows traders to gain exposure to changes in an underlying market's price without normally owning the underlying asset.
Do I own the asset when trading a CFD?
Normally, no. The trader owns a contractual position linked to the asset's price rather than the underlying asset itself.
Can you lose money trading CFDs?
Yes. CFDs are high-risk leveraged products and losses can occur rapidly when markets move against a position.
Can CFD losses exceed the initial margin?
The economic loss on a position can exceed the amount initially deposited as margin. Whether a retail client's total account balance can become negative depends on the regulatory regime and protections applicable to that account.
What is CFD leverage?
Leverage allows a trader to obtain greater market exposure than the capital deposited as margin. It magnifies both gains and losses.
What is CFD margin?
Margin is the amount required to open or maintain a leveraged CFD position. It should not be confused with the total value of the position.
Do CFDs expire?
Some CFD structures may not have a fixed expiry, while others can be linked to contracts with expirations or rollover arrangements. Product specifications should be checked for each instrument.
Are CFDs the same as forex?
No. Forex is an asset market; CFD is a contract structure. Currency exposure may be offered through CFDs depending on the provider and jurisdiction.
Are CFDs the same as futures?
No. Both are derivatives, but their trading venue, standardization, expiration, pricing and counterparty structure can differ substantially.
Can CFDs be used for hedging?
Yes, CFDs can be used to offset some market exposures. However, hedging introduces its own costs and risks and does not necessarily eliminate losses.
Is CFD trading halal?
There is no single answer that can be determined merely from the label “CFD” or “swap-free account.” The structure can involve questions concerning ownership, leverage, financing, contractual terms and other elements considered differently by Islamic-finance scholars. Anyone requiring a Shariah assessment should evaluate the specific product and contractual structure with a suitably qualified authority rather than relying solely on a broker's account label.
Are CFDs legal?
That depends on the jurisdiction. CFDs are regulated and available to retail clients in some countries, restricted in others, and may not be offered in the same form everywhere.
Learning to trade can feel overwhelming at first. New traders are introduced to charts, financial markets, leverage, order types, technical indicators, economic news, and risk management—often all at the same time.
The right way to learn trading is not to memorise every term or immediately search for the “best strategy.” It is to build your knowledge in the correct order.
A beginner should first understand how markets work, choose one market to study, learn how trades are executed, develop a risk management process, and practise in a demo environment before considering live trading.
This guide explains that process step by step. It also shows how Evest’s educational resources, market tools, and demo environment can support the learning journey.
What Is Trading?
Trading is the process of buying, selling, or taking a position in a financial instrument with the aim of benefiting from a change in its price.
Depending on the market and product, traders may participate in:
Stocks
Currencies
Commodities
Stock indices
Cryptocurrencies
Derivative products such as CFDs
For example, a trader may expect the price of a company’s shares to rise after strong financial results. Another trader may expect one currency to strengthen against another after an interest-rate announcement.
The trader’s result depends on whether the market moves in the anticipated direction, the size of the position, the costs of the trade, and how risk is managed.
Trading does not mean that every position must be held for only a few minutes. Some traders open and close positions during the same day, while others hold positions for several days, weeks, or longer.
Trading vs Investing: What Is the Difference?
Trading and investing both involve financial markets, but they normally use different time horizons and decision-making processes.
Factor
Trading
Investing
Main objective
Benefit from price movements
Build value over a longer period
Typical holding period
Minutes, days, weeks, or months
Several years or longer
Main focus
Price action, market events, timing, and risk
Business quality, valuation, income, and long-term growth
Activity level
Usually more active
Usually less active
Costs
Can increase with frequent transactions
Usually fewer transactions
Risk approach
Position-level risk management
Portfolio allocation and diversification
Common analysis
Technical, fundamental, or both
Mainly fundamental, but not exclusively
The distinction is not absolute. A long-term investor may use technical analysis when entering a position, while a position trader may study economic and company fundamentals.
The key difference is usually the trader’s objective and expected holding period.
What Are the Main Trading Styles?
Trading styles should not be confused with financial markets. Stocks and currencies are markets or asset classes. Day trading and swing trading describe how a person approaches those markets.
Day Trading
Day traders normally open and close positions within the same trading day.
This approach requires:
Regular market monitoring
Fast decision-making
Clear entry and exit rules
Strong emotional control
Careful management of trading costs
Day trading can be complex and may produce substantial losses in a short time, particularly when leverage is involved. Investor.gov warns that day trading is complicated and that leveraged trading increases risk.
Swing Trading
Swing traders attempt to capture price movements that develop over several days or weeks.
They may combine:
Chart patterns
Support and resistance levels
Market momentum
Economic events
Company or sector news
Swing trading may suit people who cannot monitor charts throughout the entire day, although positions remain exposed to overnight or weekend market movements.
Position Trading
Position traders hold trades for longer periods, sometimes for several weeks or months.
This style usually gives more weight to:
Macroeconomic trends
Company fundamentals
Interest-rate cycles
Long-term chart structures
Major supply-and-demand changes
Position trading requires patience. It may involve fewer decisions, but the trader must still manage market risk and avoid holding a position simply because they do not want to accept a loss.
Scalping
Scalping involves taking many short-duration positions in an attempt to capture small price movements.
It requires fast execution, close attention to spreads and costs, and a high level of discipline. It is generally not the most suitable starting point for a complete beginner because small execution mistakes can quickly accumulate.
Which Financial Markets Can Beginners Learn?
Each market behaves differently. The best market to study first depends on your schedule, knowledge, risk tolerance, location, and the products available to you.
Stock Trading
Stocks represent ownership interests in publicly traded companies when purchased as the underlying asset.
Stock traders may analyse:
Revenue and earnings
Business growth
Company announcements
Industry conditions
Valuation
Market sentiment
Price trends
A stock can also be available through a derivative product rather than direct ownership. Beginners must therefore check whether they are purchasing an underlying share or trading a contract linked to its price.
Forex Trading
Forex trading involves exchanging one currency against another, such as EUR/USD or GBP/USD.
Currency prices may react to:
Interest-rate decisions
Inflation
Employment data
Central-bank statements
Political developments
International trade and capital flows
Foreign exchange activity takes place across global financial centres throughout the working week. The Bank for International Settlements reported average global FX turnover of approximately $9.6 trillion per day in April 2025.
The market’s size does not make forex trading easy or low-risk. Beginners must understand currency pairs, pips, spreads, margin, leverage, and the effect of economic news before trading.
Commodity Trading
Commodities include products such as:
Gold
Oil
Natural gas
Silver
Agricultural products
Commodity prices can respond to factors that may be less important in other markets, including:
Production levels
Inventories
Weather
Transport disruptions
Geopolitical events
Changes in global demand
A trader studying oil, for example, should understand that a technical chart does not explain every price movement. Supply decisions and geopolitical developments may change market conditions quickly.
Index Trading
A stock index tracks a group of companies. Examples include indices representing major US, European, or Asian markets.
Index trading allows a trader to follow the performance of a broader market rather than one company. However, index prices can still be influenced by a small number of large companies, monetary policy, economic data, and overall investor sentiment.
Cryptocurrency Trading
Cryptocurrencies are digital assets whose prices can be highly volatile.
They may react to:
Market liquidity
Regulation
Technology developments
Security incidents
Institutional demand
Social sentiment
Changes in risk appetite
The CFTC warns that virtual-currency markets can carry substantial volatility and that leverage amplifies the risks associated with price movements.
Beginners should not treat cryptocurrencies as an easier alternative to traditional markets simply because they are available throughout most of the week.
Spot Trading vs CFD Trading
Before opening a position, a trader should understand exactly what product is being traded.
Spot or Underlying-Asset Trading
In spot or underlying-asset transactions, the trader normally buys or sells the asset itself, subject to the market structure and product terms.
For example, purchasing an underlying share may provide ownership rights associated with that share, depending on the arrangement and applicable rules.
CFD Trading
A contract for difference is a derivative. The trader does not necessarily own the underlying asset. Instead, the result is based on the price difference between opening and closing the contract.
CFDs may allow traders to:
Take long or short positions
Access multiple markets through one account
Use leverage
Trade smaller position sizes
However, those features also introduce significant risk.
CFDs are complex leveraged products. The FCA states that they are high-risk and unsuitable for some retail consumers, while its required risk warnings emphasise that most retail client accounts lose money when trading CFDs.
The instrument type, ownership structure, fees, leverage, market hours, and protections can vary by product, location, account, and legal entity. Traders should review the relevant product terms before placing a trade.
How to Learn Trading in 8 Steps?
A structured learning process prevents beginners from jumping randomly between markets, indicators, strategies, and online opinions.
Step 1: Define Why You Want to Learn Trading
Start by identifying your real objective.
Ask yourself:
Do I want to understand financial markets?
Am I interested in active trading or long-term investing?
How much time can I realistically spend studying and monitoring markets?
What level of financial loss could I tolerate?
Am I using money that I may need for essential expenses?
Trading should not be treated as a guaranteed replacement for employment or as a quick solution to financial pressure.
A realistic objective might be:
“Over the next three months, I want to understand one market, learn basic order types and risk management, and test one trading process in a demo account.”
That objective is more useful than:
“I want to make $1,000 every day.”
The first objective focuses on skills and execution. The second focuses on an outcome the trader cannot control.
Step 2: Choose One Market to Study First
A common beginner mistake is trying to learn stocks, forex, commodities, indices, and cryptocurrencies at the same time.
Each market has different:
Trading hours
Price drivers
Terminology
Costs
Volatility
Products
Risk considerations
Choose one market and study its mechanics before expanding.
For example, someone who chooses forex should first understand:
Base and quote currencies
Major and minor currency pairs
Pips
Spreads
Trading sessions
Economic calendars
Margin and leverage
Someone learning stock trading should focus on:
Company shares
Exchanges
Earnings reports
Market orders
Limit orders
Trading sessions
Corporate announcements
Focusing on one market does not mean trading only that market forever. It means reducing complexity during the learning stage.
Step 3: Learn How Prices and Trades Work
Before using indicators, understand what happens when you place an order.
Learn the meaning of:
Bid price
Ask price
Spread
Position size
Long position
Short position
Profit and loss
Margin
Leverage
Volatility
Liquidity
Slippage
Bid and Ask
The bid is generally the price available to a seller, while the ask is generally the price available to a buyer.
The difference between the two is the spread.
A narrower spread may reduce the direct cost of entering and exiting a position, but spreads can change during volatile or less liquid market conditions.
Long and Short Positions
A long position is normally opened when a trader expects the price to rise.
A short position is normally opened when a trader expects the price to fall.
The ability to take a short position depends on the market and the product being used.
Slippage
Slippage occurs when a trade is executed at a different price from the one expected.
It can happen when:
Markets are moving quickly
Liquidity is limited
Important news is released
The requested order size cannot be filled at one price
Slippage means that a stop order or market order may not always be filled at the exact price displayed when the order is submitted.
Step 4: Understand the Main Order Types
Orders are instructions sent to a trading platform.
Market Order
A market order instructs the platform to execute a trade at the best available market price.
It prioritises execution, not an exact price.
Limit Order
A limit order sets a maximum purchase price or minimum sale price.
It provides greater control over price, but the trade may not be executed if the market does not reach the limit.
Stop Order
A stop order activates after a specified price is reached. It then normally becomes a market order.
Stop orders can help manage risk, but they do not guarantee an exact execution price during fast-moving markets.
Investor.gov identifies market, limit, and stop-loss orders as common order types and explains the different execution conditions attached to each.
Take-Profit Order
A take-profit order is designed to close a position after the market reaches a selected profit level.
It helps the trader define an exit before emotion influences the decision.
An order should not be used without understanding how it behaves under the specific platform and market conditions.
Step 5: Learn Risk Management Before Strategy Selection
A trading strategy determines when a trader may enter or exit.
Risk management determines whether the trader can survive when the strategy produces losses.
No legitimate strategy wins every trade.
A beginner’s risk framework should answer:
How much of my capital can be exposed on one trade?
Where will the trade be closed if the idea is wrong?
How is position size calculated?
What is the maximum acceptable daily or weekly loss?
When should trading stop temporarily?
Am I using leverage?
Could market gaps or slippage increase the loss?
Position Sizing
Position size should be calculated from the amount the trader is prepared to lose—not from the amount they hope to earn.
For example:
Trading capital: $2,000
Maximum planned risk: 1%
Maximum planned loss: $20
Distance between entry and stop: determined by the setup
Position size: adjusted so the planned loss remains close to $20
This is a simplified example. Actual results can differ because of gaps, slippage, fees, financing charges, and execution conditions.
Leverage
Leverage allows a trader to control a position whose notional value is larger than the capital committed as margin.
Suppose $100 of margin controls a $1,000 position. A 2% movement in the position equals $20 before costs.
That means:
A favourable 2% move may produce a $20 gain.
An unfavourable 2% move may produce a $20 loss.
Relative to the $100 margin, the movement represents 20%.
Leverage does not improve the quality of a trading decision. It increases the financial impact of the decision.
Investor.gov and the CFTC warn that leveraged and margin trading can amplify losses and may be unsuitable for inexperienced market participants.
Step 6: Learn Technical and Fundamental Analysis
Technical and fundamental analysis examine the market from different perspectives.
Technical Analysis
Technical analysis studies price behaviour and market activity.
Common elements include:
Trends
Support and resistance
Candlestick patterns
Chart formations
Volume
Moving averages
Momentum indicators
Volatility indicators
Technical analysis may help answer:
Is the market trending or ranging?
Where could an entry be considered?
Where would the trading idea become invalid?
What price level may attract buyers or sellers?
An indicator should support a decision process, not replace one.
Using several indicators that calculate similar information does not necessarily improve the analysis.
Fundamental Analysis
Fundamental analysis studies the economic, financial, and business factors that may influence an asset.
For stocks, this may include:
Revenue
Earnings
Debt
Cash flow
Competitive position
Management guidance
Industry conditions
For currencies, it may include:
Interest rates
Inflation
Employment
Economic growth
Central-bank policy
Political risk
For commodities, it may include:
Supply
Inventories
Production
Weather
Transportation
Geopolitical events
Technical vs Fundamental Analysis
Question
Technical Analysis
Fundamental Analysis
What does it study?
Price, patterns, trends, and market activity
Economic, business, political, and financial factors
Common use
Timing and risk levels
Understanding the reason behind a market move
Time horizon
Short, medium, or long
Usually medium or long, but news can have immediate effects
Main limitation
Patterns can fail
The market may react differently from what the data appears to suggest
Many traders combine both approaches.
For example, fundamental analysis may identify why a currency could strengthen, while technical analysis may help define an entry, stop level, and possible target.
Step 7: Practise With a Demo Account
A demo account allows traders to practise using virtual funds rather than real capital.
It can be used to learn:
Platform navigation
Order placement
Position sizing
Stop-loss and take-profit orders
Chart tools
Trade documentation
Strategy testing
Evest currently provides a demo environment with virtual funds, market data, and access to a broad selection of financial instruments. Its educational ecosystem also includes beginner, intermediate, and advanced courses covering subjects such as forex, candlesticks, chart patterns, cryptocurrencies, stocks, and trading tools.
However, demo trading has limitations.
A demo account cannot fully reproduce:
The emotional pressure of losing real money
Fear of missing out
Hesitation
Revenge trading
The temptation to increase risk after a loss
Every live execution condition
A trader should therefore use a demo account to test behaviour and process—not only to generate virtual profits.
Step 8: Evaluate Whether You Are Ready for Live Trading
A profitable demo week does not prove that a trading process is reliable.
Before considering live trading, a beginner should be able to answer yes to most of the following:
I can explain the product I am trading.
I understand whether I own the asset or trade a derivative.
I know the costs attached to the product.
I use a written trading plan.
I calculate position size before entering.
I define the invalidation point before opening the trade.
I have tested the same process over a meaningful sample.
I record my trades in a journal.
I do not change strategy after every loss.
I understand how leverage affects my account.
I use capital I can afford to lose.
I do not expect guaranteed income.
The transition to live trading should normally involve smaller risk than the demo account—not larger positions to recover the time spent learning.
Essential Trading Concepts Every Beginner Should Know
Before placing your first trade, it’s important to understand the Essential Trading Concepts Every Beginner Should Know. Building a strong foundation in market basics, risk management, and trading terminology will help you make informed decisions and develop the confidence needed to navigate financial markets effectively.
Spread
The spread is the difference between the bid and ask prices.
It represents one of the costs that can affect the result of a trade.
Commission
A commission is a transaction fee charged for executing certain trades.
The existence and amount of commission depend on the broker, product, account, and market.
Overnight Financing
Some leveraged positions may incur charges when held beyond a specified time.
Traders should check:
When the charge applies
How it is calculated
Whether the rate can change
Whether different conditions apply to Islamic accounts
Volatility
Volatility describes the degree and speed of price movement.
Higher volatility may create more trading opportunities, but it also means that losses can develop more quickly.
Liquidity
Liquidity describes how easily an asset can be bought or sold without causing a significant price change.
Liquidity can vary by:
Instrument
Trading session
Order size
Market event
Time of day
Margin
Margin is the capital required to open or maintain a leveraged position.
It is not the same as the total value of the position and should not be treated as the maximum possible economic risk without reviewing the product terms.
Margin Call and Stop-Out
A margin call may occur when account equity falls below a required level.
A stop-out process may automatically close one or more positions when margin conditions are no longer met.
The exact levels and process depend on the platform, account, product, and applicable rules.
Drawdown
Drawdown measures the decline from a previous account peak.
For example, if an account rises to $5,000 and then falls to $4,000, the drawdown from that peak is 20%.
Drawdown helps a trader evaluate whether the strategy’s risk is acceptable—not only whether the final result is profitable.
How to Build a Beginner Trading Plan?
A trading plan defines the conditions under which the trader is allowed to act.
A basic plan should include the following sections.
1. Market
Which instrument or market will you trade?
Example:
“I will study and trade only major currency pairs during the learning stage.”
2. Trading Schedule
When are you allowed to monitor and trade?
Example:
“I will analyse the market between 8:00 and 10:00 GMT and will not open trades outside that period.”
3. Setup
What conditions must exist before entering?
Example:
The broader market is trending.
Price returns to a previously identified support area.
Momentum confirms the direction.
No major economic announcement is due within the next 15 minutes.
4. Entry Rule
What exact event triggers the trade?
The entry rule should be clear enough that another person could understand whether the conditions were met.
5. Invalidation Rule
At what point is the trading idea considered wrong?
A stop should be connected to the logic of the trade, not placed randomly because the trader wants to risk a specific number of points.
6. Position Size
How will position size be calculated so that the planned loss remains within the allowed risk?
7. Exit Rule
Will the trade close at:
A fixed target?
A technical level?
A defined risk-to-reward ratio?
A trailing stop?
A specific time?
8. Daily Loss Limit
How many losing trades or how much account loss will cause trading to stop for the day?
9. Review Process
What will be recorded after the trade?
A useful journal includes:
Date
Market
Entry
Stop
Target
Position size
Reason for entry
Screenshot
Result
Whether the plan was followed
Emotional state
Lesson learned
A Practical Weekly Learning Routine
Beginners often spend too much time watching charts and too little time reviewing decisions.
A more balanced weekly routine could include:
Day 1: Market Education
Study one concept, such as:
Order types
Support and resistance
Position sizing
Economic announcements
Day 2: Chart Observation
Review historical and current charts without placing trades.
Mark examples where the concept appeared and examples where it failed.
Day 3: Strategy Practice
Apply the same trading conditions in a demo account.
Do not change the rules during the session.
Day 4: Journal Review
Review:
Entries
Exits
Risk
Rule violations
Emotional decisions
Day 5: Performance Review
Separate the result from the execution.
A losing trade that followed the plan may be better than a profitable trade based on an impulsive decision.
Weekend Review
Update one part of the process only when the trading journal provides enough evidence.
Do not rebuild the entire strategy because of one losing week.
Common Trading Mistakes Beginners Should Avoid
Understanding Common Trading Mistakes Beginners Should Avoid is one of the fastest ways to build a stronger trading foundation. By recognizing these common pitfalls early, you can improve your decision-making, manage risk more effectively, and develop disciplined trading habits from the start.
Trading Without Understanding the Product
A trader may know the direction they expect but not understand:
Whether the product is leveraged
Whether the asset is owned
The financing costs
The market hours
The margin requirements
That creates risk before the market analysis even begins.
Using Too Much Leverage
High leverage allows a large position to be opened with limited margin.
This may make small market movements produce large changes in account equity.
Leverage should never be used simply because it is available.
Risking Money Needed for Essential Expenses
Trading capital should not come from:
Rent
Loan payments
Emergency savings
Education fees
Essential household expenses
The CFTC advises speculative traders to use risk capital and warns against combining unfamiliar products, leverage, and unverified online advice.
Copying Trades Without Understanding Them
A trade can only be managed properly when the trader knows:
Why it was opened
What would invalidate it
How much is at risk
When it should close
Following an online signal without this information transfers the decision but not the responsibility.
Changing Strategies Too Quickly
Every strategy can experience losing trades.
Changing the rules after each loss prevents the trader from collecting a meaningful sample and understanding whether the problem is:
The strategy
Market conditions
Execution
Risk
Discipline
Overtrading
Overtrading can happen when a trader:
Feels bored
Tries to recover a loss
Attempts to reach a daily profit target
Believes more trades automatically mean more profit
More activity does not necessarily create better opportunities.
Ignoring Trading Costs
A strategy can appear profitable before costs but perform poorly after including:
Spread
Commission
Financing
Slippage
Currency-conversion charges
Taxes, where applicable
Treating a Stop-Loss as a Guarantee
A stop order helps define an exit process, but fast price movements or gaps may lead to execution at a different price.
Risk calculations should leave room for execution uncertainty.
Focusing Only on Win Rate
A strategy can have a high win rate and still lose money if the average loss is much larger than the average profit.
Another strategy can win less frequently and remain profitable if losses are controlled and winning trades are sufficiently larger.
Win rate should be evaluated alongside:
Average win
Average loss
Maximum drawdown
Trading costs
Rule compliance
Overall expectancy
How Evest Supports the Trading Learning Process?
A pillar guide should not end after defining the concepts. Beginners also need an environment where they can study, practise, observe markets, and measure progress.
Beginner, intermediate, and advanced educational levels
Courses on forex, stocks, cryptocurrencies, candlesticks, chart formations, and trading tools
A demo trading account using virtual funds
Access to markets including stocks, currencies, commodities, cryptocurrencies, and indices
Web and mobile trading platforms
Market analysis and trading tools
These services can support different stages of the learning process.
Education Stage
The Evest Trading Academy can be used to build foundational knowledge before a beginner attempts to create a strategy.
Platform-Learning Stage
A demo account can help users practise navigating the platform, placing orders, and understanding how positions appear in an account.
Analysis Stage
Market tools can support chart analysis, economic monitoring, and trade preparation.
Evaluation Stage
The trader can use a journal and demo history to determine whether decisions are consistent and whether risk rules are being followed.
The availability of a tool does not remove the trader’s responsibility to understand it. Educational resources and demo practice should be used to improve decision quality—not to create the impression that profits are guaranteed.
Products, features, conditions, and protections may vary according to account type, jurisdiction, and the Evest entity providing the service. The applicable account terms, fee schedule, regulatory information, and risk documents should be reviewed before live trading.
Is Trading Halal or Haram?
Trading cannot be classified as halal or haram based only on the word “trading.”
The ruling may depend on several factors, including:
The asset being traded
The business activity behind the asset
The structure of the contract
Whether ownership is established
Settlement and possession requirements
Interest or financing charges
Short selling
Margin and leverage arrangements
Excessive uncertainty
Whether the transaction resembles gambling rather than legitimate trade
Currency trading, gold trading, shares, derivatives, and leveraged products may each raise different questions.
AAOIFI publishes separate Sharia standards dealing with subjects such as currency trading and gold, which demonstrates that the issue requires examination of the actual transaction—not a general statement that all trading is either permissible or prohibited.
An account described as “Islamic” or “swap-free” should also be reviewed according to its full terms, fees, contract structure, and the products available through it.
Evest offers an Islamic account option, but users seeking a religious ruling should review the current account terms and consult a qualified Sharia adviser who understands modern financial products.
This section provides general educational information and is not a religious ruling.
FAQs
How do I teach myself to trade?
Start with basic market education, choose one market, learn order types and risk management, and practise one written process in a demo account. Avoid moving between strategies before collecting enough evidence to understand what is working and what is not.
How long does it take to learn trading?
There is no fixed learning period. Understanding basic terminology may take weeks, while developing consistent execution and emotional discipline can take much longer. Progress should be measured by decision quality and rule compliance, not only by time.
Can I make $1,000 per day from trading?
Trading does not provide a reliable or guaranteed daily income. A result such as $1,000 per day would depend on capital, risk, market conditions, costs, experience, and strategy performance. Forcing a fixed daily target may encourage overtrading or excessive leverage.
Should beginners learn stocks or forex first?
Neither market is automatically best for every beginner. Stocks may appeal to people interested in companies and business performance. Forex may appeal to people interested in economics, currencies, and central-bank policy. The better starting market is the one the beginner can study consistently and understand clearly.
Should I use technical or fundamental analysis?
Both can be useful. Fundamental analysis helps explain why an asset may move. Technical analysis may help identify timing, risk levels, and market structure. The chosen method should match the market, trading style, and holding period.
Can a demo account make me ready for live trading?
A demo account helps build platform and strategy skills, but it does not reproduce every psychological and execution challenge of live trading. A trader should move beyond demo only after showing consistent process, risk control, and understanding—not simply because the virtual account made a profit.
Is leverage necessary for trading?
No. Some products are traded without leverage, while other products use it as a core feature. Leverage increases exposure and can amplify both gains and losses. Beginners should understand the full risk before using it.
What is the most important skill in trading?
Risk-controlled decision-making is more important than predicting every market movement. A trader does not need to be correct on every trade. The trader needs a process that controls losses, avoids impulsive decisions, and can be evaluated objectively.
The Dow Jones is one of the most recognized indicators of financial market performance worldwide. It reflects the strength of major U.S. companies and gives investors a quick snapshot of economic health. Understanding how this index moves can help traders make smarter decisions in volatile markets. Whether you are a beginner or an experienced investor, following market trends is essential. In this guide, you will explore key insights that shape investment strategies today.
Great question — and one that financial professionals have debated for decades. The short answer is: the Dow is still relevant, but it’s far from the best measure of the market. Here’s a breakdown of the arguments on both sides:
Where the Dow Still Matters?
It’s still widely watched. The Dow Jones Industrial Average is reported alongside the S&P 500 and Nasdaq in virtually every major market update, meaning it functions as a cultural and media benchmark. When people ask “how did the market do today?”, the Dow is often the first number cited.
It’s a solid blue-chip barometer. The DJIA contains 30 component companies across various industries and provides a view of the U.S. stock market and economy. For tracking the health of large, established American corporations — think Apple, JPMorgan, Boeing, Chevron — it remains a decent snapshot.
It’s used as a consensus benchmark. Economic data releases, like the ISM services index, are regularly measured against “Dow Jones consensus estimates,” so the Dow’s name carries weight in macroeconomic forecasting too.
Where the Dow Falls Short?
It only covers 30 stocks. The U.S. stock market has thousands of publicly listed companies. The S&P 500 covers 500 of the largest, making it a far broader and statistically more representative gauge of the overall economy.
It’s price-weighted, not market-cap weighted. This is the Dow’s most significant flaw. A stock trading at $500/share influences the index far more than one trading at $50, regardless of the company’s actual size or importance. The S&P 500, by contrast, weights companies by their total market value — a more logical and accurate method.
It misses huge swaths of the economy. High-growth sectors like biotech, smaller tech firms, and emerging industries are largely absent. The Nasdaq Composite and S&P 500 do a much better job capturing where the economy is actually growing.
The Bottom Line
The Dow is best understood as a historical artifact that refuses to retire gracefully. It’s over 130 years old, deeply embedded in media and public consciousness, and still useful as a quick pulse check on blue-chip America. But for investors, economists, and analysts who need an accurate picture of the broader market, the S&P 500 is the more meaningful benchmark — and has been for decades.
Think of the Dow like an old compass: it still points in roughly the right direction, but you wouldn’t rely on it alone to navigate complex terrain.
Definition of the Dow Jones Industrial Average (DJIA)
The Dow Jones Industrial Average index, often abbreviated as DJIA, is a stock market index that tracks 30 large, publicly traded companies listed on stock exchanges in the United States. These companies represent a wide range of industries such as technology, healthcare, energy, consumer goods, and finance.
Unlike broader indices that may cover hundreds of firms, the Dow Jones Industrial Average focuses on a select group of leading companies, making it easier to follow but also highly symbolic. Its performance is viewed as a reflection of the general health of the U.S. economy and, by extension, a signal to the global economy.
The index is unique because it is a price-weighted index rather than a market capitalization-weighted one. This means that companies with higher stock prices exert more influence on the index, regardless of their total market value.
Dow Jones in 2026: Current Level and Year-to-Date Performance
The Dow Jones Industrial Average is currently trading at approximately 51,784 points as of June 2026, having reached a new record high of 52,278 on June 17, 2026.
The DIA ETF — the primary vehicle tracking the DJIA — has gained approximately 6.1% year-to-date as of mid-June 2026, underperforming the S&P 500 (+8.6%) and significantly lagging the tech-heavy Nasdaq-100 (+17.7%) over the same period.
The DJIA rose 12.7% in 2025, climbing from around 42,660 at the January open to 48,063 by year-end. Industrials led sector contributions, with Caterpillar surging 59%, while Financials ranked second driven by Goldman Sachs’ 54–55% advance.
The underperformance relative to broader indices in 2026 reflects the Dow’s lower technology weighting — a structural characteristic that makes it less sensitive to the AI-driven rally that has benefited the Nasdaq and S&P 500 disproportionately this year.
History of the Dow Jones
The Dow Jones was created in 1896 by Charles Dow and Edward Jones, the founders of the Dow Jones & Company. Initially, the index included only 12 industrial companies, many of which operated in heavy industries such as oil, gas, steel, and railroads. Over time, the Dow Jones Industrial Average evolved, reflecting the transformation of the U.S. economy from industrial powerhouses to a diversified mix of sectors, including technology, services, and healthcare.
The Dow has witnessed major historical events:
The Great Depression of the 1930s saw the Dow Jones share market lose nearly 90% of its value.
During World War II, the index became a measure of wartime economic resilience.
The 2008 global financial crisis once again highlighted its importance as a market thermometer.
In recent years, with technology giants like Apple and Microsoft included, the index reflects modern economic drivers.
This rich history gives the Dow Jones Industrial Average immense significance as both a historical record and a forecasting tool.
How does the Dow Jones Work?
The Dow Jones is one of the most well-known stock market indexes in the world. Understanding how it works helps traders and investors gauge overall market performance and economic trends.
Price-weighted index explained
Unlike most indices that are weighted by market capitalization, the Dow Jones is price-weighted. This means that companies with higher stock prices have a greater impact on the index than those with lower prices, even if the latter have larger overall market caps.
Calculation methodology
The value of the Dow Jones Industrial Average index is determined by adding the stock prices of all 30 companies and dividing the sum by a special divisor. This divisor accounts for stock splits, dividends, and other corporate actions, ensuring the index remains consistent and comparable over time.
How companies are added or removed
Companies in the Dow Jones Industrial Average are not permanent members. The committee overseeing the index adds or removes companies based on factors such as industry representation, financial health, and market relevance. For example, as technology became dominant, firms like Apple and Microsoft were added, while traditional heavy industry firms were removed.
Major Components of the Dow Jones
The Dow Jones Industrial Average index includes 30 leading U.S. companies. These firms span across sectors like technology, healthcare, finance, retail, and energy. Some well-known names include Apple, Microsoft, Goldman Sachs, Johnson & Johnson, and Walmart.
The inclusion of diverse industries ensures the Dow Jones Industrial Stock Market reflects the broad economic picture, but it is not all-encompassing. For example, it excludes many small and mid-sized firms. Nonetheless, its components are carefully chosen to represent the backbone of the U.S. economy.
Top Dow Components Driving Performance in 2026
Because the Dow is price-weighted, a small number of high-priced stocks drive a disproportionate share of daily index movement. Understanding which components have the most mechanical influence helps traders anticipate how specific news events will affect the index.
Goldman Sachs (GS) — The Dominant Driver
Goldman Sachs maintains one of the highest nominal share prices in the index, meaning a 1% move in GS moves the DJIA significantly more than a 1% move in Apple. Goldman has delivered an 18.4% return over the trailing year, serving as a primary engine for index performance, fuelled by a resurgence in M&A deal-making and IPO activity.
Caterpillar (CAT) — The Macro CapEx Barometer
Caterpillar functions as the index’s macro capital expenditure barometer. Its stock price is highly sensitive to infrastructure spending and reshoring trends — making it a useful indicator of industrial economic momentum within the Dow.
Apple (AAPL) — The Market Cap vs. Price Paradox
Despite being the world’s largest company by market capitalisation, Apple’s daily impact on the Dow is relatively constrained because its share price is nominally lower than Goldman Sachs or UnitedHealth. This is the clearest illustration of the Dow’s price-weighting flaw — the most valuable company in the world is not the most influential component in the index.
Factors Affecting the Dow Jones
Several key factors influence the movement of the Dow Jones:
Economic indicators
Reports such as GDP growth, unemployment rates, inflation, and consumer confidence have a strong impact on the Dow Jones Industrial Average. Positive indicators often boost the index, while negative ones can drag it down.
Corporate earnings
The performance of the 30 companies directly affects the Dow Jones share market. Strong quarterly earnings often drive the index higher, while disappointing results can weigh it down.
Federal Reserve policy and interest rates
Interest rate changes by the Federal Reserve are closely tied to the Dow Jones risk centre analysis. Rising rates can negatively impact stock valuations, while lower rates usually encourage investment and drive the index higher.
Geopolitical events
Global tensions, wars, and trade policies also affect the Dow Jones Industrial Average, making it sensitive to international developments.
Key Risks for the Dow Jones in 2026
Key macro risks for the Dow in 2026 center on elevated valuations, AI investment returns potentially faltering, and persistent inflation forcing Federal Reserve policy shifts. US equities trade at premiums, demanding consistent earnings execution, with the Dow’s concentration in mega-caps amplifying downside if earnings growth slows to single digits or margins compress due to wage pressures
Several specific risk factors are worth monitoring:
Federal Reserve Policy: The Dow closed 500 points lower following the first Fed meeting under new Chair Kevin Warsh in June 2026, which triggered a surge in bond yields — illustrating the index’s direct sensitivity to interest rate signals.
Valuation Concerns: The Dow’s yield advantage over other indices is at multi-decade lows, and its relative valuation premium is unusually elevated — factors that could constrain future returns even without a sharp economic downturn.
Technology Underexposure: With only 18.38% allocated to the technology sector, the Dow is structurally underweight relative to the S&P 500 (~40%) and Nasdaq-100 (~55%). In an AI-driven market environment, this structural gap explains much of the Dow’s 2026 underperformance relative to broader indices.
Geopolitical Events: In June 2026, the Dow climbed over 450 points on news of a potential US-Iran deal that could reopen the Strait of Hormuz and lower oil prices — a reminder that geopolitical developments can produce sharp, rapid index moves in either direction.
Dow Jones Price Forecast: 2026–2030
Period
Forecast Range
Key Assumptions
End 2026
53,000 – 55,784
Continued earnings growth, stable Fed path
2027
54,000 – 58,000
Moderate expansion, lower rates
2028
56,000 – 65,000
AI monetisation, infrastructure spend
2030
61,779 – 85,438
Long-term compound growth, depends on scenario
Coin Price Forecast projects the Dow could reach 53,733 by end of 2026, while Long Forecast offers a more optimistic scenario of 55,784 in December. Long-term projections suggest the index could approach 100,039 by 2037 under bullish assumptions.
All figures are third-party projections and should be treated as directional guidance, not investment advice.
How to Gain Dow Jones Exposure: ETFs and CFDs?
Investors cannot buy the Dow Jones Industrial Average directly, but several instruments provide efficient exposure:
SPDR Dow Jones Industrial Average ETF (DIA)
The DIA ETF is the only liquid vehicle that tracks the price-weighted DJIA with 1:1 precision. With nearly $35 billion in assets under management and an expense ratio of 0.16%, it provides institutional-grade access to all 30 Dow components with minimal tracking error. It also distributes a monthly dividend, making it appealing to income-oriented investors.
Dow Jones CFDs
Traders can access Dow Jones price movements through Contracts for Difference (CFDs) on platforms like Evest. CFDs allow traders to take both long and short positions on the index without owning the underlying ETF or individual stocks. This approach is particularly suited to shorter-term traders seeking to capitalise on intraday or short-term directional moves in the DJIA.
Key difference: ETF ownership is suitable for long-term investors seeking broad exposure. CFD trading is suited to active traders focused on price movement rather than dividends or long-term appreciation. Both approaches carry risk, and CFD trading in particular involves the risk of significant losses due to leverage.
How to Trade the Dow Jones?
Before trading the Dow Jones, it’s essential to understand the right approach and tools needed to navigate the market effectively. Using a reliable platform like Evest can help traders execute strategies efficiently and access global markets with ease.
Choose a trusted platform: Trade the Dow Jones through Evest, which provides access to global indices with advanced tools and a user-friendly interface
Understand market trends: Analyze economic data, news, and overall market sentiment before entering any trade
Use technical analysis: Apply charts, indicators, and price patterns on Evest’s platform to identify entry and exit points
Manage risk properly: Set stop-loss and take-profit levels to protect your capital and control potential losses
Leverage wisely: Use leverage available on Evest carefully to enhance returns without exposing yourself to high risk
Practice with a demo account: Start with Evest’s demo account to test strategies and gain confidence before trading with real money
Common Mistakes When Trading the Dow Jones
Before trading the Dow Jones, it’s important to understand that it behaves differently from other indices due to its structure and sensitivity to key factors. Many traders fall into common mistakes that can be avoided with better awareness.
Ignoring price weighting: Assuming all companies impact the index equally, while higher-priced stocks actually have more influence
Overlooking economic news: Not tracking key indicators like interest rates, inflation, and employment data
Focusing only on the index: Ignoring the performance of individual companies that drive most of the movement
Trading without a strategy: Making decisions based on emotions or short-term market noise
Overleveraging: Using excessive leverage, which can amplify losses.
Ignoring global events: Not considering geopolitical and international market influences
What is The Difference Between Dow Jones and Other Indices?
Before comparing indices, it’s important to understand that each one represents the market in a different way. The Dow Jones, S&P 500, and Nasdaq are among the most widely followed benchmarks, but they differ in composition, weighting, and purpose.
Index
Key Features
What Makes It Different
Dow Jones (DJIA)
Tracks 30 large, well-established U.S. companies across various industries; price-weighted index
Simpler and more symbolic; influenced more by stock price than company size
Includes 500 of the largest U.S. companies; market-cap weighted
Broader market representation; considered a more accurate measure of overall U.S. market performance
Nasdaq Composite
Contains over 3,000 companies, heavily focused on technology and innovation sectors
Highly growth-oriented; more volatile and sensitive to tech sector movements
FAQs
What is the Dow Jones?
The Dow Jones Industrial Average Index is a price-weighted stock market index of 30 major U.S. companies that serves as a benchmark for market performance.
Is Apple a Dow or Nasdaq?
Apple is listed on the Nasdaq exchange but is also a component of the Dow Jones.
What is the difference between the Dow and the S&P?
The Dow tracks 30 price-weighted stocks, while the S&P 500 includes 500 market-cap-weighted stocks, offering a broader representation of the U.S. market.
Can I invest in Dow Jones?
You cannot invest directly in the Dow itself, but you can invest through ETFs, futures, CFDs, and mutual funds that track its performance on platforms like Evest.
Saudi Exchange Sees Net Foreign Inflows Fall By 13.4% YoY In 9M 2025:
The Saudi Exchange (Tawadul)—the largest in the Middle East, with a market capitalization of $2.5 trillion as of the end of September 2025—has experienced a slowdown in net foreign inflows this year, including from investors in GCC countries and beyond. The decline comes amid shifting global markets, tighter monetary policies, and fluctuating oil prices.
Net foreign purchases in the main market fell to $4.5 billion (SAR 16.7 billion) in the first nine months of 2025, compared to $5.1 billion (SAR 19.3 billion) during the same period last year, reflecting increased caution among international investors. This slowdown occurred despite ongoing market reforms and strong IPO momentum, indicating a shift in the dynamics of foreign participation in Saudi equities.
In parallel with declining foreign inflows, Tadawul All-Share Index (TASI) dropped 4.4% year-to-date to close at 11,503 points at the end of September, making it the weakest performer among the seven main GCC indices. However, TASI gained 7.5% in September alone.
In early October 2025, the Capital Market Authority (CMA) invited market participants and stakeholders to share feedback on a proposal to open the primary market to all categories of non-resident foreign investors, allowing them to invest directly for the first time. In September 2025, the media reported that CMA was close to easing rules that cap foreign ownership of listed companies at 49%.
Here’s a closer look at the reasons for the 13.4% year-on-year slowdown in foreign inflows to the Saudi Exchange’s primary market during the first nine months of 2025, along with the outlook for the remainder of the year.
In the fast-paced world of financial markets, traders are constantly searching for tools and methods that can give them an edge. One of the most widely used tools in modern trading is trading indicators. These indicators help traders analyze price movements, predict potential future trends, and make informed decisions based on data rather than guesswork. Whether you are trading stocks, forex, commodities, or even cryptocurrency trading, understanding how to use the right trading indicators can be the difference between consistent profits and frustrating losses.
What Are Trading Indicators?
At their core, trading indicators are mathematical calculations applied to the price, volume, or open interest of a security. They transform raw market data into visual signals that traders can interpret to make decisions. Think of them as filters that help you see the underlying patterns in the market that might not be immediately visible on a simple price chart.
The trading indicators’ meaning can vary depending on the context. Some indicators are designed to show the strength of a trend, while others highlight potential reversal points. Others are used to identify overbought or oversold conditions, signaling when it may be time to buy or sell.
Trading indicators are not limited to a single asset class. They can be used across equities, forex, commodities, and even digital assets. For example, trading indicators for crypto have gained popularity among investors in Bitcoin and Ethereum, while trading indicators for forex are essential for currency traders navigating volatile exchange rates.
It’s important to note that trading indicators should not be viewed in isolation. They work best when used in combination with other tools, such as chart patterns, risk management strategies, and fundamental analysis. Evest highlights that the best results come from a balanced approach—combining technical signals from trading indicators with broader economic context.
For traders starting, building familiarity with trading indicators is an essential first step. This allows them to understand what each indicator shows, when to use it, and how to avoid false signals.
10 Common Trading Indicators You Can Use
Successful trading decisions rely on understanding the signals within market movements. Technical indicators help traders interpret trends and make more confident, informed choices.
Simple Moving Average (SMA)
The SMA is one of the most basic yet effective trading indicators. It smooths out price data by calculating the average closing price over a specific period. Traders use it to identify the overall direction of the market and to confirm trends. For example, if the price is consistently above the 50-day SMA, it often signals an upward trend.
Exponential Moving Average (EMA)
Unlike the SMA, the EMA gives more weight to recent prices. This makes it more responsive to sudden market changes. Forex and crypto traders often prefer EMA because of its sensitivity, making it ideal for volatile assets.
Moving Average Convergence Divergence (MACD)
The MACD is a momentum indicator that shows the relationship between two moving averages. It helps traders spot potential buy or sell signals when the short-term average crosses above or below the long-term average. It is particularly useful in developing a trading indicators strategy.
Fibonacci Retracements
Based on Fibonacci ratios, this indicator identifies potential levels of support and resistance. Traders use it to predict possible price reversals. It is widely used in both forex and commodity markets.
Stochastic Oscillator
This indicator compares a closing price to its price range over a set period. It signals whether the market is overbought or oversold, helping traders time their entries and exits more effectively.
Bollinger Bands
Bollinger Bands consist of a moving average and two standard deviation lines. They show market volatility and potential breakout zones. When the band’s contract is renewed, it often signals that a big move is coming.
Relative Strength Index (RSI)
RSI measures the speed and change of price movements. An RSI above 70 typically signals overbought conditions, while below 30 indicates oversold. This makes it one of the most trusted trading indicators that forex traders rely on.
Average Directional Index (ADX)
ADX measures the strength of a trend without indicating direction. A strong ADX reading suggests a powerful trend, which can help traders avoid false signals in choppy markets.
Standard Deviation Indicator
This indicator measures the degree of variation in prices. Higher values mean higher volatility, while lower values indicate a more stable market. It’s often paired with other indicators like Bollinger Bands.
Ichimoku Cloud Indicator
One of the most comprehensive trading indicators, the Ichimoku Cloud provides insights into support, resistance, momentum, and trend direction. Though it looks complex, experienced traders use it for its all-in-one functionality.
Types of Trading Indicators
Trading indicators can be categorized into different groups depending on their function:
Leading vs. Lagging Indicators
Leading indicators predict future price movements (e.g., RSI, Stochastic Oscillator).
These highlight the direction of the market. Examples include Moving Averages and ADX.
Momentum Indicators
These measure the speed of price changes. RSI and Stochastic Oscillator fall into this category.
Volatility Indicators
Indicators like Bollinger Bands and Standard Deviation show how much the market is fluctuating.
Volume Indicators
These measure the number of transactions to confirm the strength of price moves. Popular examples include On-Balance Volume (OBV).
By understanding trading indicator types, traders can choose the best combination that suits their strategies.
How to Use Trading Indicators Effectively?
Using trading indicators effectively is not about adding as many as possible to your chart. Instead, it’s about understanding what each one does and combining them for confirmation. For example, pairing a trend indicator like SMA with a momentum indicator like RSI can provide stronger signals.
Evest advises traders to:
Avoid relying on a single indicator.
Always test indicators on demo accounts before applying them live.
Adjust indicator settings based on the asset and timeframe.
Combine technical indicators with fundamental insights for well-rounded decisions.
Advantages and Limitations of Trading Indicators
Trading indicators can be powerful tools for analyzing market behavior and identifying opportunities. However, understanding their strengths and weaknesses is essential for using them effectively.
Advantages:
Provide objective signals based on math, not emotions.
Work across all asset classes (stocks, forex, commodities, crypto).
Help identify market entry and exit points.
Can be customized to match trading styles.
Limitations:
No indicator is 100% accurate.
False signals are common in volatile markets.
Lagging indicators react slowly to sudden market changes.
Over-reliance can lead to ignoring fundamentals.
Evest encourages traders to treat trading indicators as tools, not guarantees.
Building a Trading Strategy with Indicators
Creating a trading strategy involves more than just choosing indicators. It’s about combining them wisely to form a clear, consistent approach that supports smart decision-making.
Choosing the Right Indicators
Select indicators that complement each other rather than duplicate information. For example, combining MACD with Bollinger Bands offers both trend and volatility perspectives.
Backtesting Strategies
Backtesting allows traders to test indicators on historical data. This helps in understanding how a strategy would have performed before risking real capital.
Adjusting Based on Market Conditions
Markets change constantly. What works in a trending market may not work in a sideways one. Traders must adapt their use of indicators accordingly.
Tips for Beginners
Starting your trading journey can be exciting yet challenging. With the right mindset and practical guidance, beginners can build confidence and develop strong trading habits.
Start with Simple Indicators
Avoid getting overwhelmed. Beginners should start with SMA, RSI, or MACD before moving on to complex tools like Ichimoku.
Focus on Understanding Market Context
Indicators are only part of the picture. Always consider economic events, news, and market sentiment.
Practice on Demo Accounts
Evest offers demo trading accounts where beginners can practice without financial risk. This is the best way to gain confidence.
Evest Services
Evest offers a comprehensive range of services designed to support traders at every level. From advanced tools to expert guidance, each service aims to enhance your trading experience.
Commission-Free Stock Trading
Evest allows clients to make stock trading with zero commission, making it an attractive choice for investors who want to access international markets with minimum costs.
CFD Trading
The platform provides access to a wide range of financial assets through Contracts for Difference (CFDs), including stocks, forex, indices, commodities, and cryptocurrencies. This gives traders great flexibility to diversify their strategies.
WebTrader Platform
Evest offers a WebTrader platform that works directly from the browser without the need to download extra software. It features a user-friendly interface with real-time charts and Market analysis tools to help investors make better trading decisions.
Copy Trading
With the copy trading service, beginners or passive investors can automatically copy the trades of professional traders. This allows users to benefit from the experience of experts and potentially generate steady profits.
Demo Account
Evest provides a free demo account where traders can practice with virtual funds. This service is especially useful for beginners to learn trading basics and test strategies without risking real money.
Islamic Trading Accounts
Evest offers Islamic (Swap-Free) accounts that are free from interest charges, making them compliant with Shariah law and suitable for Muslim traders.
Smart Analytics Tool (Evest Analytics)
The platform integrates AI-powered analytics tools that deliver accurate market insights and instant alerts, helping traders to identify investment opportunities at the right time.
Mobile Trading App
Evest provides a modern mobile application for iOS and Android, enabling users to trade anywhere, anytime, with the same tools and features available on the web platform.
Multiple Deposit & Withdrawal Options
Evest supports various payment methods for deposits and withdrawals, including:
Credit and debit cards
E-wallets
Bank transfers
This ensures flexible and convenient financial transactions for traders worldwide.
In Conclusion
Trading indicators are powerful tools for traders across markets. They simplify decision-making by converting raw price and volume data into actionable signals. From simple moving averages to advanced Ichimoku clouds, mastering these tools requires patience, testing, and discipline.
Evest empowers traders by providing access to a reliable commodity trading platform, forex, and crypto markets, while offering insights into how to use trading indicators for long-term success. Whether you are a beginner or an advanced trader, combining the right tools with a proper strategy can greatly enhance your performance.
FAQs
Which indicator is best for trading?
There is no single best indicator. It depends on your style and market. Many traders prefer combining RSI with moving averages for reliability.
What is the 5 3 1 rule in trading?
This rule suggests focusing on 5 currency pairs, 3 strategies, and 1 trading timeframe. It helps traders stay disciplined.
Which indicator is 100% accurate?
No trading indicator is 100% accurate. All tools have limitations, and risk management is always necessary.
What are the big 3 indicators?
The big three are Moving Averages, MACD, and RSI. They are widely used across all markets for their versatility.
The financial markets are evolving at an incredible pace, with new methods and technologies emerging to make trading more accessible to a global audience. Among these innovations, copy trading has gained a special place in modern investment strategies. It allows traders—both experienced and beginners—to connect in an environment where knowledge is shared, risks are minimized, and opportunities are expanded.
In this blog, we’ll break down what copy trading is, how it works, its pros and cons, the things you need to know before starting, and why it’s becoming one of the fastest-growing trends in finance. We’ll also explore how to choose the right online trading platforms, what features to consider, and how Evest can guide you to long-term success.
What is Copy Trading?
At its core, copy trading is a method where investors automatically replicate the trades of more experienced traders. Instead of spending months or years developing complex strategies, beginners can instantly benefit from the knowledge and expertise of professionals.
The copy trading meaning is straightforward: once you connect your account to an expert trader on a platform like Evest, any action they take—buying or selling assets—is mirrored in your account proportionally. This way, your results align closely with theirs.
This method appeals to different groups:
Beginners – who may have limited knowledge but want exposure to forex, stocks, or crypto.
Busy Professionals – who don’t have time to monitor charts daily.
Diversifiers – investors who want to spread their capital across multiple strategies.
Copy trading can apply to multiple markets. In copy trading forex, you might replicate trades from experts specializing in currency pairs. In copy trading crypto, you can mirror investors who navigate the volatile world of Bitcoin, Ethereum, and altcoins. Some traders even follow copy trading signals—real-time recommendations shared by professionals.
Unlike signal-following alone, copy trading offers automation. The moment the expert makes a move, the same move happens in your account. That’s why many consider it a hands-free trading solution that balances simplicity and effectiveness.
How Does Copy Trading Work?
Understanding how copy trading operates is crucial before diving in. The process typically follows these steps:
Selecting a Copy Trading Broker or Platform
The first step is choosing a copy trading broker like Evest that offers reliable access to experts. Brokers provide the infrastructure that connects investors and traders.
Choosing a Trader to Copy
On platforms, traders are ranked by performance, risk score, and trading history. You can view detailed statistics before selecting whom to copy.
Allocating Funds
Once you’ve chosen a trader, you decide how much capital to allocate. For example, if you allocate $1,000 and the expert invests 10% in EUR/USD, the same percentage applies to your account.
Automated Execution
Trades are mirrored instantly. If the expert makes a profit, you do as well—proportionally.
Adjustments and Monitoring
You can stop copying, change the trader, or adjust your allocated funds at any time.
Copy trading strategy varies. Some traders focus on conservative long-term growth, while others prefer aggressive short-term gains. Platforms like Evest let you evaluate both styles and choose what aligns with your risk appetite. Automation is a major advantage. Unlike traditional investing, where execution delays or emotional decisions can harm results, copy trading ensures trades are executed instantly and without human error.
Pros and Cons of Copy Trading
Copy trading has gained popularity among both beginner and experienced investors as an easy way to participate in the financial markets. It offers unique advantages and potential risks that every trader should understand before getting started.
Pros
Accessibility for Beginners: Copy trading for beginners removes the steep learning curve by letting them learn through observation.
Diversification: You can copy multiple traders across forex, stocks, and crypto.
Time-Saving: No need to constantly analyze markets or track news.
Learning Opportunity: Beginners observe experts’ decisions and gradually build their own skills.
Dependency: Success depends on the expert you copy. Poor choices can lead to losses.
Fees and Commissions: Some platforms charge for copy trading, which may reduce overall returns.
Risk Exposure: Even the best traders face losses. Blindly following without risk management can be dangerous.
Lack of Control: Automated replication means you don’t influence trade decisions.
In summary, copy trading is powerful but not risk-free. It’s a tool to enhance performance, not a guaranteed path to profits.
What to Know Before Copy Trading?
Before starting, there are several points every trader should consider:
Understand the Basics – Even though copy trading simplifies investing, having a basic grasp of forex, crypto, or stock markets is essential.
Risk Management – Don’t invest all your capital with one expert. Diversify across multiple traders.
Evaluate Performance – Look at long-term consistency, not just short-term results.
Be Aware of Fees – Platforms may charge spreads, commissions, or management fees.
Stay Informed – While automation handles execution, staying updated on global events improves decision-making.
For those new to investing, copy trading for beginners guides often recommend starting with small amounts to test the waters before committing larger capital.
Why is Copy Trading Gaining Popularity?
Several factors explain the rapid growth of copy trading:
Democratization of Finance – Platforms like Evest allow anyone with an internet connection to participate.
Technology – Advanced algorithms and faster networks make real-time mirroring possible.
Shift in Investor Behavior – People want passive income opportunities that fit busy lifestyles.
Transparency – Most copy trading platforms display trader histories, risks, and strategies clearly.
Community Growth – Social media and trading communities boost awareness of copy trading signals and shared strategies.
With retail trading expanding globally, copy trading provides a simple yet powerful bridge between experts and novices.
Choosing the Right Copy Trading Platform
Selecting the right copy trading platform is a crucial step toward achieving consistent trading success. With numerous options available, understanding what sets each platform apart can make all the difference.
Key Features to Look For
When choosing a platform like Evest, consider:
User-friendly interface
Wide selection of traders
Transparent performance metrics
Real-time execution
Evaluating Platform Security and Regulation
A trusted copy trading broker ensures compliance with regulations, client fund protection, and strong cybersecurity.
Fees and Commission Structures
Always review costs. Some brokers charge performance fees, others spreads. Understanding these ensures you maximize profits.
Evest offers a balance of security, transparency, and competitive pricing—making it an ideal choice for both beginners and professionals.
How to Get Started with Copy Trading?
Starting with copy trading is simple:
Open an Account – Register with a platform like Evest.
Verify Identity – For security, complete KYC (Know Your Customer) steps.
Deposit Funds – Choose an amount you’re comfortable investing.
Browse Traders – Use filters like performance, risk, and experience.
Start Copying – Allocate funds and let automation do the work.
Monitor and Adjust – Track performance regularly and diversify across traders.
For those exploring specific markets, copy trading in forex is one of the most popular choices. Forex’s high liquidity and volatility make it ideal for strategies tested through copy trading. Similarly, copy trading crypto offers opportunities in Bitcoin and altcoins, though with higher risk.
Evest Services
Evest provides a suite of financial and copy-trading services designed to help users benefit from the expertise of seasoned traders. Their offerings aim to combine transparency, security, and accessibility in the world of online investing.
Commission-Free Stock Trading
Evest allows clients to make stock trading with zero commission, making it an attractive choice for investors who want to access international markets with minimum costs.
CFD Trading
The platform provides access to a wide range of financial assets through Contracts for Difference (CFDs), including stocks, forex, indices, commodities, and cryptocurrencies. This gives traders great flexibility to diversify their strategies.
WebTrader Platform
Evest offers a WebTrader platform that works directly from the browser without the need to download extra software. It features a user-friendly interface with real-time charts and analysis tools to help investors make better trading decisions.
Copy Trading
With the copy trading service, beginners or passive investors can automatically copy the trades of professional traders. This allows users to benefit from the experience of experts and potentially generate steady profits.
Demo Account
Evest provides a free demo trading account where traders can practice with virtual funds. This service is especially useful for beginners to learn trading basics and test strategies without risking real money.
Islamic Trading Accounts
Evest offers Islamic (Swap-Free) accounts that are free from interest charges, making them compliant with Shariah law and suitable for Muslim traders.
Smart Analytics Tool (Evest Analytics)
The platform integrates AI-powered analytics tools that deliver accurate market insights and instant alerts, helping traders to identify investment opportunities at the right time.
Mobile Trading App
Evest provides a modern mobile application for iOS and Android, enabling users to trade anywhere, anytime, with the same tools and features available on the web platform.
Multiple Deposit & Withdrawal Options
Evest supports various payment methods for deposits and withdrawals, including:
Credit and debit cards
E-wallets
Bank transfers
This ensures flexible and convenient financial transactions for traders worldwide.
Conclusion
Copy trading has transformed how people approach investing. It blends automation with human expertise, allowing traders of all levels to benefit from professional insights. Whether you’re interested in forex, crypto, or stock markets, Evest provides the ideal copy trading platforms to start your journey.
By following experts, applying sound risk management, and staying engaged, investors can leverage copy trading as a stepping stone to financial growth. While risks exist, with the right platform and approach, copy trading is one of the most effective ways to learn, diversify, and succeed in modern financial markets.
FAQs
Is copy trading a good idea?
Yes, copy trading can be highly effective, especially for beginners who want exposure to markets while learning from experts. However, results depend on the trader you follow.
Is copy trading legal?
Yes, it is legal in most jurisdictions when conducted through regulated brokers and platforms like Evest.
How much can you make day trading with $1000?
Earnings vary based on market conditions, risk tolerance, and the trader followed. Some may achieve steady gains, while others face losses. It’s essential to manage risk.
How to start copy trading?
Begin by opening an account with a trusted copy trading broker, verifying your identity, depositing funds, and selecting a professional trader to follow.
Double Award Winner Evest Marks the Success of ‘Evest Talk’ at the Museum of the Future:
Following a series of milestones that have strengthened its position in the digital investment landscape,
Evest continues its remarkable journey in 2025,
Having recently received two prominent awards that highlight its leadership and market trust.
The company was recognized as one of the Top 100 Trusted Financial Institutions of 2025 at the Middle East Financial Markets Awards
and also won the title of Best Broker in the GCC region for 2025 at Forex Expo Dubai 2025,
acknowledging its commitment to transparency and innovation in electronic trading services.
Building on this dual success, Evest crowned its achievements with an exceptional celebration at the Museum of the Future in Dubai,
hosting a special event to mark the success of four consecutive seasons of its discussion program “Evest Talk.”
This program is the first of its kind launched by a financial brokerage firm within the Museum of the Future,
combining technology and knowledge to redefine engagement between traders, investors, and financial decision-makers.