
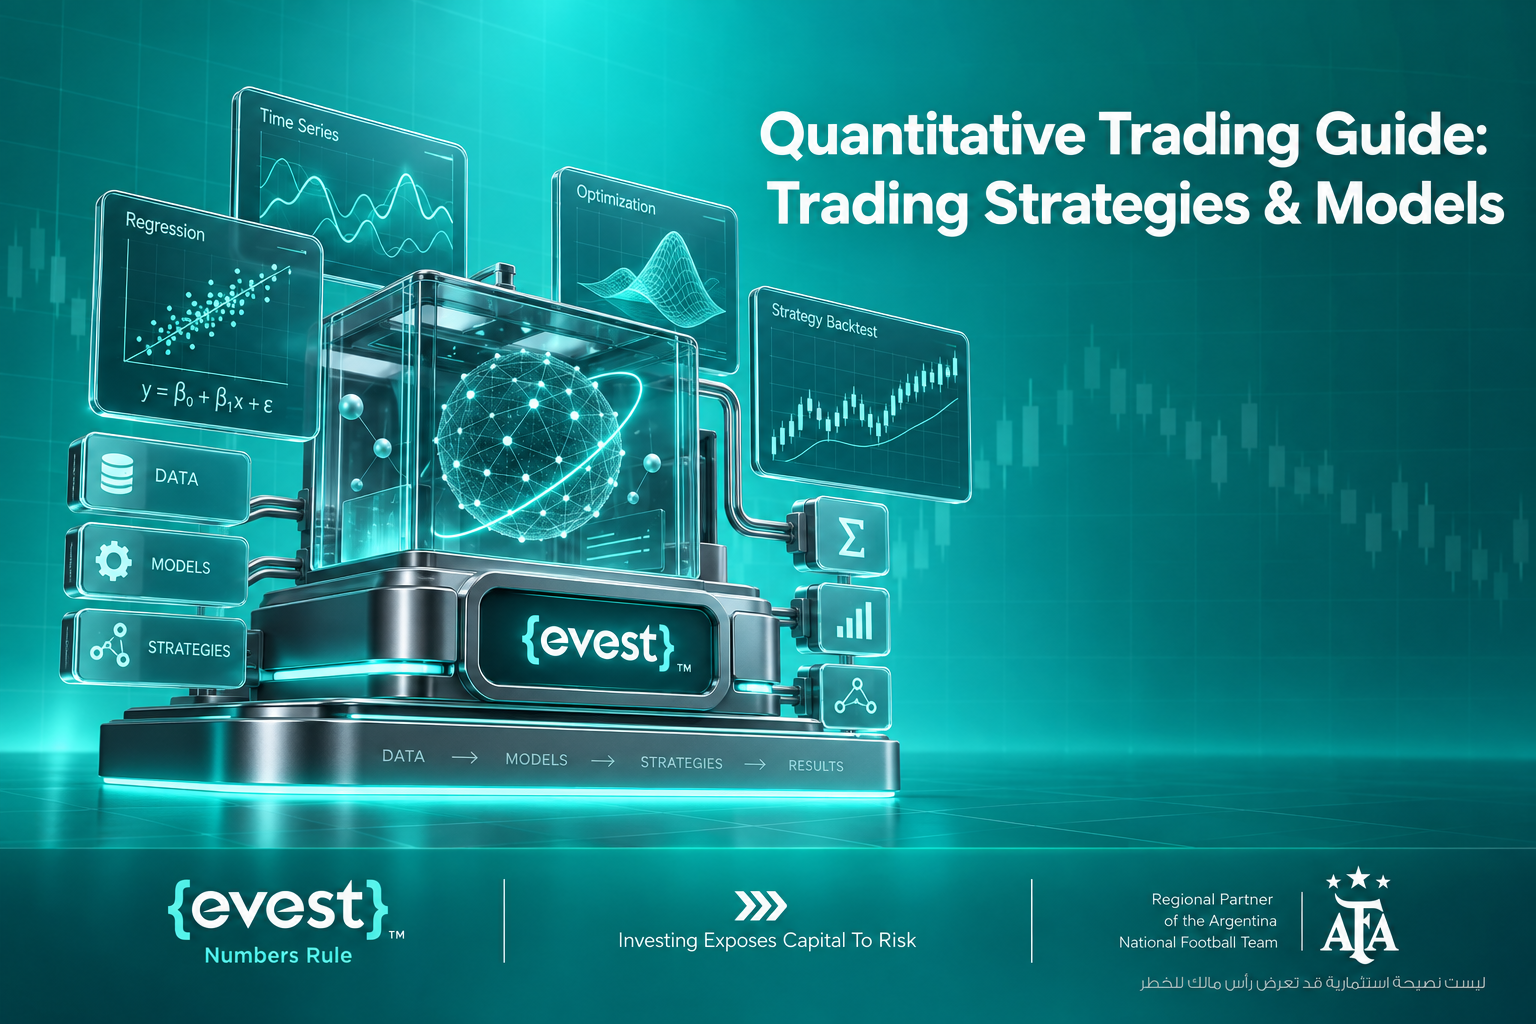
As financial markets become faster and more data-driven, relying solely on intuition or basic chart patterns is no longer enough for many professionals. This shift brings up a critical question for modern traders: what is quantitative trading, and how does it change the way we approach the markets? By replacing emotional decisions with mathematical models, statistical analysis, and historical data, quantitative methods offer a structured way to test ideas and manage risk. In this comprehensive guide, we explore how these strategies work, the models behind them, and what retail traders need to know before applying data-driven approaches.
What Is Quantitative Trading?
Quantitative trading uses measurable data and predefined rules to support trading decisions. Instead of deciding whether to buy or sell because a chart “looks strong” or because market sentiment feels positive, a quantitative approach turns an idea into conditions that can be tested. Those conditions may use price, volume, volatility, correlations, macroeconomic data, company fundamentals, or other variables.
The goal is not to remove uncertainty from markets. No model can do that. The goal is to create a repeatable decision process that can be measured, compared, improved, and monitored over time. This makes quantitative trading different from discretionary trading, where the trader has more freedom to interpret information differently from one situation to another.
For traders, the main value of a quantitative approach is structure. A strategy can define when a market setup is valid, how large a position should be, when a trade should be closed, and how much risk is acceptable. That structure can reduce inconsistent decision-making, but it does not eliminate model risk, execution risk, or losses.
Key ideas to keep in mind are:
- Quantitative trading starts with a testable market hypothesis.
- Data quality matters as much as the model built on top of it.
- A strategy should be validated before live use.
- Risk management remains necessary even when decisions are automated.
How quantitative trading works?
To understand how quantitative trading works, it helps to think of it as a process rather than a single formula. A trader starts with a market idea, converts that idea into measurable rules, tests those rules using historical information, and then evaluates whether the strategy remains robust enough for live conditions.
A typical workflow includes seven stages:
- Define a hypothesis, such as whether momentum, mean reversion, valuation, or a statistical relationship may create a repeatable trading signal.
- Collect relevant market data and check its quality, completeness, frequency, and consistency.
- Build quantitative trading models that translate the hypothesis into clear mathematical or statistical rules.
- Backtest the strategy on historical data while accounting for realistic costs and execution assumptions.
- Validate the model on data that was not used to build or optimize the strategy.
- Define execution and risk controls, including position sizing, loss limits, and conditions that suspend the model.
- Monitor live performance and compare actual behavior with the assumptions used during research.
This workflow is iterative. A model that performs well during one period may weaken as market conditions change. Quantitative trading therefore requires ongoing review rather than a “build once and forget it” mindset.
Data and Quantitative Analysis in Trading
Good models depend on good inputs. Quantitative analysis in trading may use historical prices, returns, trading volume, volatility, interest rates, economic indicators, financial statements, correlations, or alternative datasets.
Before analysis begins, the data must be cleaned. Missing observations, duplicate records, incorrect timestamps, corporate actions, and inconsistent price histories can distort results. If a backtest uses bad data, even an advanced model may produce a misleading conclusion.
Data preparation also involves deciding how to measure variables. A momentum strategy may compare returns across several periods, while a volatility model may calculate rolling standard deviation or another measure of price movement. A relative-value model may focus on spreads or ratios between related assets.
Common model inputs may include:
- Price returns and moving relationships across time.
- Volatility, volume, liquidity, and market microstructure data.
- Fundamental or macroeconomic variables.
- Correlations, spreads, factors, and derived statistical features.
The key point is that a model should use information logically related to the hypothesis being tested. Adding more variables does not automatically create a better strategy.
Quantitative Trading Models
Quantitative trading models convert data into rules or estimated probabilities. Some models are simple and transparent, while others rely on advanced statistics or machine learning. Complexity should serve a purpose; a more complicated model is not automatically more accurate or more robust.
- A rules-based model might buy an asset when a trend indicator crosses a predefined level and exit when the trend weakens. A statistical model may estimate whether two assets have moved unusually far from their historical relationship. A factor model may rank assets based on characteristics such as value, momentum, quality, or volatility.
- Models can also be designed for different time horizons. Some operate over minutes or seconds, while others make decisions over days, weeks, or months. The shorter the time horizon, the more important execution speed, transaction costs, liquidity, and market impact may become.
- A strong model should be understandable enough that the trader knows what conditions are expected to make it work and what conditions could cause it to fail. If a model produces attractive historical results but no clear economic or market logic supports it, the result deserves extra skepticism.
Common Quantitative Trading Strategies
There is no single best approach. Different quantitative trading strategies are built around different assumptions about market behavior. A strategy that works in a trending market may struggle in a range-bound market, while a mean-reversion strategy can fail if a price relationship changes permanently.
Common approaches include:
- Mean reversion, which assumes prices or spreads may move back toward a typical historical level.
- Momentum and trend following, which look for persistence in price direction.
- Statistical arbitrage, which searches for temporary deviations in relationships between assets.
- Factor strategies, which rank securities according to measurable characteristics.
- Market-making models, which focus on providing liquidity and managing bid-ask exposure.
These labels describe broad families, not guaranteed formulas. Within each family, results depend on data quality, model design, transaction costs, position sizing, and risk control.
Mean Reversion, Momentum, and Trend Following
Mean reversion assumes certain prices, spreads, or indicators may move back toward a historical average after becoming unusually extended. A model might measure how far a price has moved from a rolling mean and look for reversal conditions when the deviation becomes extreme.
The risk is that the “normal” level may have changed because of structural, fundamental, or volatility shifts.
Momentum takes the opposite view, assuming strength or weakness may continue for a period. Trend-following models are closely related and try to participate in directional moves while reducing exposure when the trend no longer meets predefined conditions. Both approaches can struggle when markets repeatedly change direction.
Statistical Arbitrage Strategy
A statistical arbitrage strategy looks for temporary pricing differences or unusual deviations between assets that have historically shown a measurable relationship. Pairs trading is one common example.
Suppose two assets have moved together for a long period. A model may estimate their typical spread and identify when that spread becomes unusually wide. The strategy can then take opposing positions based on the expectation that the relationship may converge.
The key word is “may.” Historical correlation does not guarantee future convergence. One asset can change because of earnings, regulation, capital structure, sector conditions, liquidity, or other fundamental developments. A statistical relationship can therefore break rather than revert.
For this reason, statistical arbitrage requires more than finding two correlated charts. Traders need robust testing, sensible thresholds, liquidity controls, realistic costs, and rules for recognizing when the historical relationship may no longer be valid.
Backtesting a Quantitative Trading Strategy
Backtesting asks a simple question: how would the rules have behaved if they had been applied to historical data? The answer can help a trader evaluate potential return, drawdown, consistency, volatility, trade frequency, and sensitivity to different market conditions.
However, a strong-looking backtest can still be unreliable. A model can accidentally use information that would not have been available at the time of each historical trade. It can also be optimized so aggressively that it fits past noise instead of a repeatable market pattern.
A more reliable backtesting process should check:
- Transaction costs, spreads, slippage, and realistic execution assumptions.
- Look-ahead bias, survivorship bias, and other data problems.
- Performance across different periods and market regimes.
- Out-of-sample results using data not used during model development.
- Drawdown, volatility, trade concentration, and risk-adjusted performance.
Backtesting should therefore be treated as a filter, not proof that a strategy will make money. Historical performance describes what happened under past conditions. Live markets can behave differently.
Quantitative Trading vs Algorithmic Trading
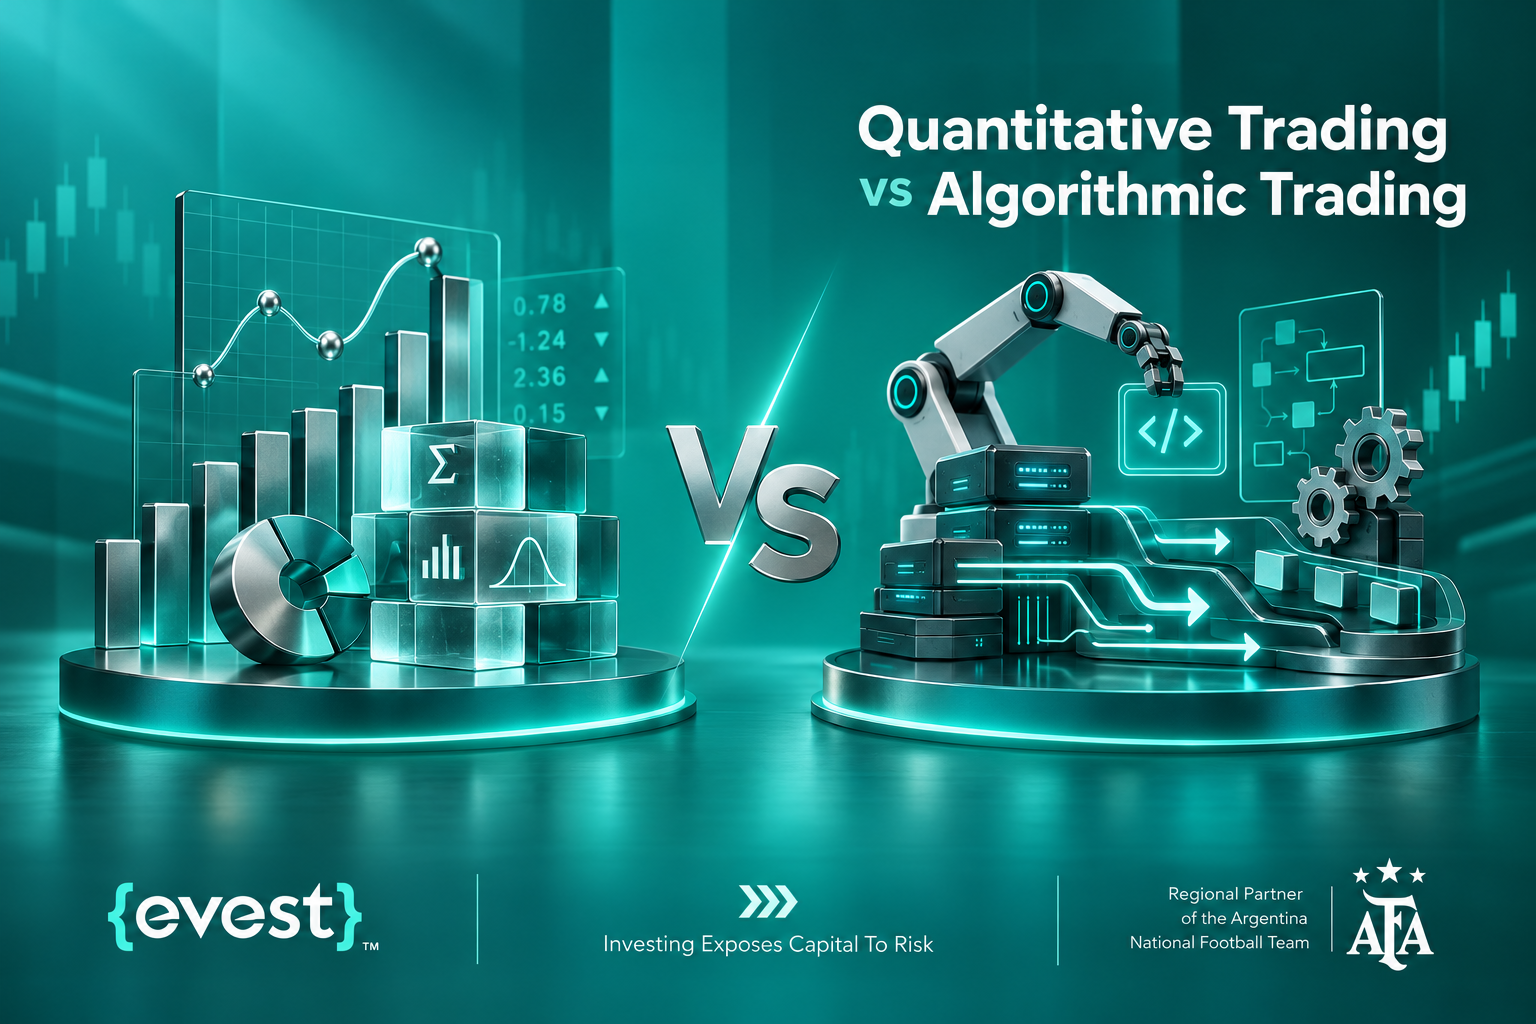
Quantitative trading and algorithmic trading overlap, but they are not identical.
| Comparison | Quantitative Trading | Algorithmic Trading |
| Focus | Focuses on generating decisions through data and statistical models. | Focuses on automating trading actions or execution. |
| How it works | A quantitative model may produce a signal for human review. | An execution algorithm can automate orders without deciding whether the investment idea itself is attractive. |
Many systems combine both: quantitative analysis identifies the opportunity and algorithms execute predefined instructions.
Technology Used in Quantitative Trading
Technology supports data processing, research, backtesting, and execution. Python is widely used for quantitative analysis, while databases, APIs, cloud infrastructure, and other tools may support larger datasets or live trading systems.
Technology should follow the strategy. A medium-term model based on daily data does not need the same infrastructure as a high-frequency system. Traders should first define the problem, then choose tools that match the data, time horizon, and execution requirements.
Risk Management in Quantitative Trading
Systematic rules can reduce emotional interference, but they do not remove risk. A model can be logically sound and still lose money because markets change, liquidity disappears, volatility rises, execution fails, or the assumptions behind the strategy stop working.
Important risks include:
- Model risk when assumptions or relationships are wrong.
- Overfitting when a strategy is tuned too closely to historical data.
- Execution risk from slippage, latency, rejected orders, or poor liquidity.
- Market-regime risk when conditions differ from the period used for testing.
- Operational risk involving software, data feeds, connectivity, or human oversight.
Risk management should be built into the model rather than added after the strategy is finished. Position sizing, exposure limits, maximum drawdown thresholds, diversification, and model suspension rules can help control how much damage a failing assumption can cause.
Can Retail Traders Use Quantitative Trading?
Yes, but the version used by an individual trader is often different from institutional quantitative trading. A retail trader can analyze historical data, build rules, run backtests, and use systematic decision frameworks without institutional infrastructure.
The key question is whether the strategy matches the trader’s resources, data access, execution quality, and risk tolerance. A simple model with transparent rules may be more useful than a complex system the trader cannot explain or monitor.
Quantitative Trading for Evest Readers
For Evest readers, quantitative trading is best understood as a framework for making data-driven decisions, not as a promise of automatic profits. The same discipline used in professional quantitative research can also improve how individual traders think about evidence, testing, and risk.
Before applying a systematic idea through Evest or any trading environment, traders should consider:
- Whether the instrument and time horizon match the strategy.
- Whether the required data and execution tools are available.
- Whether spreads, leverage, slippage, and other costs have been included.
- Whether the model has clear risk limits and conditions for stopping.
This approach helps separate research from execution. A strategy may look attractive in a spreadsheet or backtest but still be unsuitable for live trading because of costs, liquidity, leverage, or platform limitations.
Evest readers should therefore treat quantitative methods as a decision framework. The objective is to test assumptions, define rules, and understand risk before capital is exposed.
Advantages and Limitations of Quantitative Trading
The main advantage of quantitative trading is consistency. Clear rules make it easier to test performance, compare alternatives, and identify where a strategy is succeeding or failing. Quantitative systems can also process more information than a trader can reasonably evaluate manually.
The limitation is that every model simplifies reality. Markets can change faster than a model adapts, and historical results may be distorted by bias, unrealistic costs, or random patterns. The best use of quantitative trading is disciplined decision-making supported by testing, validation, execution controls, and ongoing review.
FAQs
Is quantitative trading the same as automated trading?
No. Quantitative trading focuses on using data and mathematical models to generate decisions, while automated trading focuses on executing rules through software. A strategy can be quantitative without being fully automated, and automation can exist without advanced quantitative analysis today.
Do you need coding skills for quantitative trading?
Coding is useful because it makes data analysis, backtesting, and model testing faster and repeatable. However, the important starting point is understanding the market hypothesis, the data, and the risk. Programming supports the process; it does not replace sound reasoning.
Can quantitative trading guarantee profits?
No. Quantitative trading cannot guarantee profits. Models are based on assumptions and historical information, and those relationships can change. Transaction costs, volatility, liquidity, execution problems, and unexpected market events can all cause a strategy to perform differently from its backtest.
What is the biggest risk in quantitative trading?
One major risk is believing that a model is more reliable than it really is. Overfitting, bad data, unstable relationships, and unrealistic execution assumptions can create convincing historical results. Strong validation and clear risk limits are essential before using capital.
Is quantitative trading suitable for beginners?
Beginners can study quantitative trading, but they should start with simple, understandable rules rather than complex systems. Learning data analysis, backtesting, market structure, and risk management first makes it easier to evaluate whether a strategy has logic and realistic assumptions.