
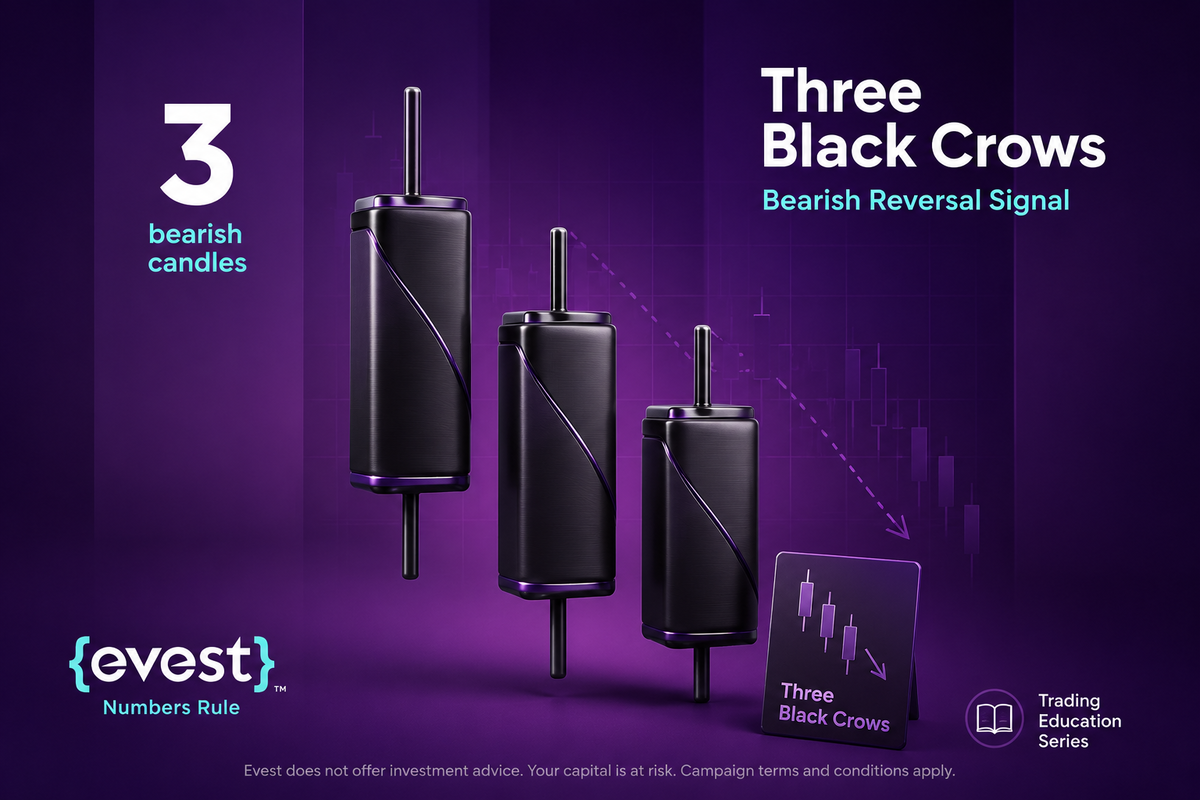
The Three Black Crows pattern is a bearish candlestick formation that may signal a shift from buying pressure to stronger selling activity. It typically appears after an established uptrend and consists of three consecutive bearish candles closing progressively lower.
Although the pattern may warn of a potential bearish reversal, it is not a guaranteed sell signal. Traders usually assess it alongside market structure, support and resistance, volume, momentum, and risk-management rules.
This Evest guide explains how to identify the Three Black Crows pattern, what it may reveal about market sentiment, how traders confirm the setup, and which risks should be considered before making a trading decision.
What is the Three Black Crows Pattern?
The Three Black Crows pattern is a three-candle bearish formation that usually appears after an established uptrend. Each candle is bearish, generally opens within the body of the previous candle, and closes below the previous close.
The formation suggests that buyers may be losing control while sellers maintain pressure across three consecutive trading sessions. Long candle bodies, relatively short wicks, and closes near the session lows can make the bearish shift more visible.
However, the formation should be treated as a warning rather than a complete trading signal. Its meaning becomes stronger when it forms near resistance, follows an extended rally, or is confirmed by a break below an important support level.
Historical Context of Candlestick Analysis
Candlestick analysis is commonly associated with Japanese rice trading history and has become a major part of modern technical analysis.
While the historical background is interesting, traders should focus more on current chart context than origin alone. A candlestick pattern only becomes useful when it is interpreted in relation to trend, volume, support and resistance, and risk.
A valid Three Black Crows formation begins with a clear upward move. Without a preceding uptrend, the three bearish candles may represent ordinary selling activity rather than a reversal.
Traders generally look for the following characteristics:
- Three consecutive bearish candles.
- Each candle closes below the previous candle’s close.
- The second and third candles open within, or close to, the body of the preceding candle.
- The candle bodies are relatively long and show sustained selling pressure.
- Each candle closes near its low, with limited lower wicks.
- The pattern forms after a visible rally rather than inside an irregular sideways range.
The candles do not need to be identical. However, small candle bodies, long lower wicks, price gaps, or mixed movement may indicate that sellers do not have consistent control.
The formation becomes more meaningful when it appears near resistance, is supported by increasing volume, or is followed by a confirmed break below support. If the third candle closes directly above a strong support zone, traders should consider the possibility of a rebound before assuming that the decline will continue.
How Timeframes Affect the Pattern?
The Three Black Crows pattern can appear on different timeframes, from intraday charts to daily and weekly charts. Its meaning depends heavily on the timeframe.
On shorter timeframes, the pattern may reflect short-term selling pressure, but it can also be more vulnerable to noise and false moves. On daily or weekly charts, the signal may carry broader implications, but confirmation is still needed.
Many traders consider higher timeframe signals more meaningful, but no timeframe makes the pattern guaranteed.
Common Mistakes to Avoid
- Trading without a clear prior uptrend: One of the biggest mistakes is trading the pattern when there is no clear upward move before it. If the market is already falling or moving sideways, the formation may simply reflect normal volatility rather than a new bearish reversal.
- Entering immediately after the third candle: Another common mistake is entering right after the third candle without checking support levels, volume, or broader trend conditions. Sometimes, by the time the third candle closes, the price may already be near a support zone, making the risk-reward ratio weak.
- Ignoring risk and position sizing: Traders should avoid using excessive leverage. A valid-looking pattern can still fail, and poor position sizing can turn a small failed setup into a large loss.
Trading Strategies Using the Three Black Crows Pattern
The Three Black Crows pattern may be used as part of a risk-managed trading plan. Some traders use it to consider short setups, while others use it as a warning to reduce long exposure or tighten risk management.
The pattern should not be the only reason to enter a trade. A stronger approach is to combine it with confirmation such as a support break, a weak retest, bearish momentum, or failure at resistance.
Before entering, traders should define the entry trigger, invalidation level, Stop Loss, Take Profit area, and position size.
1- Entry Points Confirming the Bearish Reversal
Some traders wait for confirmation after the third candle rather than entering immediately. Confirmation may include a break below a nearby support level, a weak retest of former support, or continued bearish follow-through.
The following example is hypothetical and for illustration only: if the pattern forms near a resistance area and price later breaks below support at $100, some traders may watch for a short setup below that level or after a failed retest.
Indicators such as RSI or MACD may also support the bearish case, but they should not replace price action and risk management. Volume can also help. If selling volume increases during the formation, it may strengthen the bearish interpretation.
2- Exit Points and Take Profit Levels
Exit planning should happen before entry. The goal is not to maximize every possible move, but to manage exits and reduce emotional decisions.
Some traders use previous support levels as potential Take Profit areas. Others use Fibonacci retracement or extension levels, moving averages, or a fixed risk-to-reward framework.
The following example is hypothetical and not a recommendation: if price breaks below support and the next historical support is near $90, that area may be watched as a possible profit-taking zone.
Take Profit targets are not guaranteed. Price may reverse before reaching them, especially if the move becomes overextended or if buyers defend a nearby support area.
3- Setting Stop Loss Orders to Manage Risk
Stop Loss placement is essential when trading any candlestick pattern. For the Three Black Crows pattern, some traders place the Stop Loss above the high of the pattern or above the most recent swing high.
For illustration only, if the first candle’s high is $105, a trader might place the Stop Loss slightly above that level, depending on volatility and position size.
A tighter Stop Loss may reduce risk per trade but can also increase the chance of being stopped out by normal market fluctuations. A wider Stop Loss may give the trade more room but requires a smaller position size to keep risk controlled.
Stop Loss orders reduce risk but may not execute at the exact price during gaps, fast markets, or low-liquidity conditions.
4- Integrating Volume Analysis with the Pattern
Volume can help confirm whether the Three Black Crows pattern reflects stronger selling participation. If volume increases as the bearish candles form, the setup may appear more meaningful.
If the pattern forms on weak or declining volume, the signal may be less convincing. It may reflect temporary selling rather than a broader shift in market sentiment.
Volume should support the analysis, not replace it. Traders should still consider trend, resistance, support, volatility, and market news.
Three Black Crows vs. Three White Soldiers
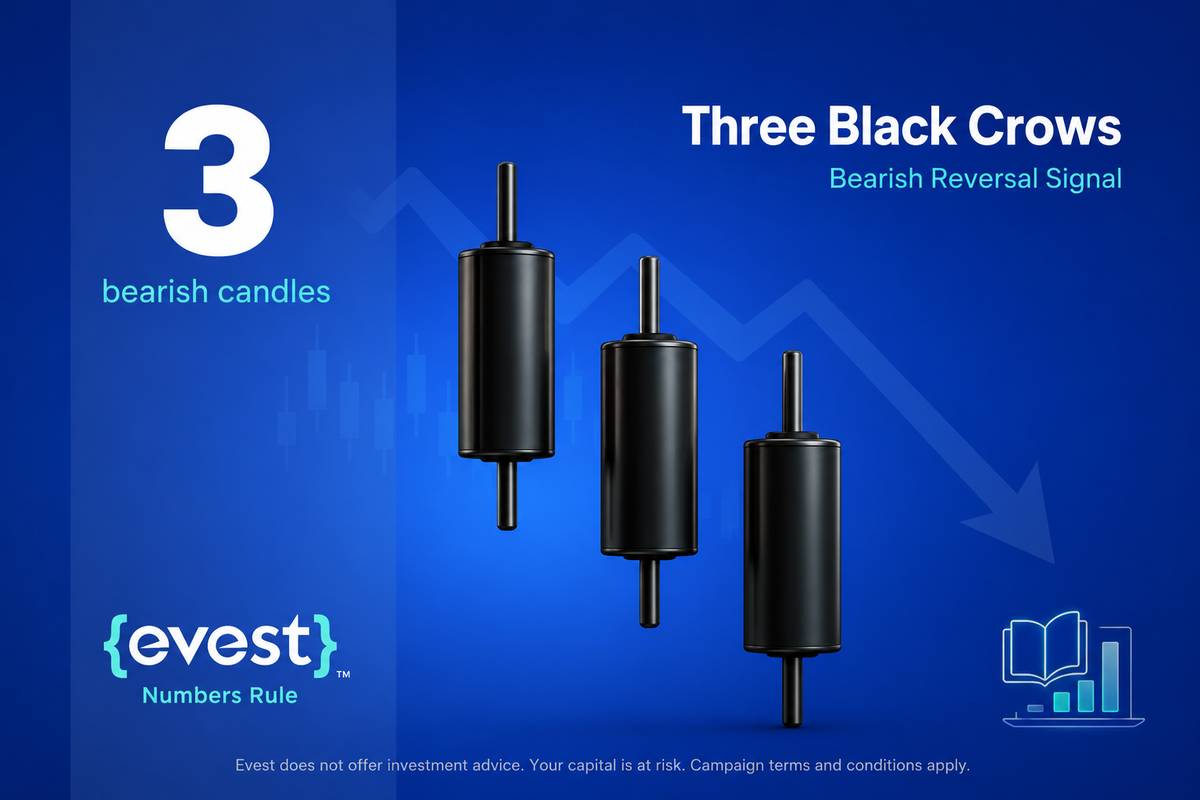
The Three Black Crows pattern is often compared with the Three White Soldiers pattern. Both are three-candle formations, but they suggest opposite market conditions.
| Pattern | Prior Trend | Candle Structure | Potential Meaning |
| Three Black Crows | Uptrend | Three bearish candles closing lower | Possible bearish reversal |
| Three White Soldiers | Downtrend | Three bullish candles closing higher | Possible bullish reversal |
Three Black Crows may suggest that sellers are gaining control after a rally. Three White Soldiers may suggest that buyers are gaining control after a decline.
Both patterns may indicate reversal potential when confirmed, but neither should be used alone.
Key Differences in Formation and Implication
The Three Black Crows pattern forms after an uptrend and shows three bearish candles. The Three White Soldiers pattern forms after a downtrend and shows three bullish candles.
The key difference is direction. Three Black Crows may reflect weakening buying pressure and growing selling pressure. Three White Soldiers may reflect weakening selling pressure and growing buying interest.
The context is as important as the candles themselves. A pattern that appears near a major support or resistance level may carry more meaning than one that appears in the middle of a range.
Reliability and Limitations of the Three Black Crows Pattern
The Three Black Crows pattern is often used as a bearish reversal setup, but its reliability varies.
There is no fixed success rate for this pattern in isolation. Its effectiveness depends on market conditions, asset class, timeframe, volatility, liquidity, and confirmation.
The pattern may fail in choppy markets, during high-impact news events, or when price reaches strong support immediately after the third candle. It may also produce false signals if traders ignore the broader trend.
A strong setup is not the same as a guaranteed outcome.
Factors That Affect Pattern Accuracy
- Pattern location matters: The Three Black Crows pattern may be more meaningful when it appears after an extended rally, near resistance, and with rising selling volume.
- Higher timeframes may add weight: The pattern may carry more significance on higher timeframes, where market noise is usually lower.
- Market conditions affect reliability: The pattern may be less reliable in sideways markets, low-liquidity assets, or extremely volatile conditions.
- News can override technical signals: Unexpected news may weaken or invalidate the pattern, even if the candle structure looks clear.
- Liquidity is important: Highly liquid assets usually produce cleaner price action, while illiquid instruments may create misleading candles due to wider spreads or low participation.
Combining Three Black Crows with Technical Indicators
Technical indicators can help support the interpretation of the Three Black Crows pattern, but they should not replace price action or risk management.
RSI may be useful if the pattern appears while the market is overbought or showing bearish divergence. MACD may support the bearish interpretation if momentum is weakening or if the MACD line crosses below the signal line.
These signals may strengthen the bearish case, but they do not confirm a guaranteed decline.
Bollinger Bands and Fibonacci Tools
Bollinger Bands can help traders understand whether price is extended or volatility is changing. If the pattern forms near the upper band after a strong rally, it may suggest that price is facing rejection. If price later breaks lower with expanding volatility, the bearish case may become more relevant.
Fibonacci levels can also be used to identify possible retracement or target areas. However, Fibonacci levels are projection tools, not guaranteed targets.
These tools are best used with support and resistance, trend structure, and risk planning.
Support and Resistance as Confluence Factors
Support and resistance are important when analyzing the Three Black Crows pattern. If the pattern appears near a major resistance level, it may suggest that buyers failed to push the price higher.
The following example is hypothetical only: if the pattern forms near a historical resistance around $110, traders may interpret it as rejection of higher prices. If price then breaks below a key support level, the bearish setup may become more meaningful.
However, if the pattern ends directly above strong support, traders should be careful. The price may bounce from that area instead of continuing lower.
Practical Application in Saudi Arabia and the UAE
The Three Black Crows pattern can appear in Saudi and UAE markets, but interpretation depends on liquidity, trading hours, regulation, and market structure.
It may appear on indices such as TASI or on individual regional stocks. However, examples are illustrative only and do not represent recommendations.
Local news, earnings announcements, economic data, oil price movements, and geopolitical developments may all affect market behavior in the region. Traders should consider these factors before relying on any technical pattern.
Regulatory Considerations in Saudi Arabia and the UAE
Regulatory oversight depends on the legal entity, product type, and jurisdiction. Traders should verify the licensed entity before opening an account or trading any financial product.
In Saudi Arabia, capital-market products are typically subject to the relevant market regulator. In the UAE, regulation may differ depending on whether the entity operates onshore or within a financial free zone. SAMA may be relevant for banking and certain financial services, while capital-market or brokerage products may fall under other relevant authorities.
Regulatory frameworks may provide complaint and dispute-resolution channels, but protections vary by product, entity, and jurisdiction. Traders should not assume that one license covers all products or all regions.

How to Study the Three Black Crows Pattern with Evest?
When studying the Three Black Crows pattern through Evest, traders can begin by displaying the selected instrument as a candlestick chart and reviewing the formation across more than one timeframe.
The candles should then be assessed in relation to the preceding trend, support and resistance levels, trading volume, and any relevant momentum indicators. Traders should avoid identifying the pattern from candle color alone, as three bearish candles inside a sideways market may not represent a genuine reversal.
New traders may practise recognising the formation and testing their analysis before committing real capital. The purpose of this process is to develop a consistent method for evaluating the pattern rather than predicting every market move.
Charting and analysis tools do not remove market risk. The Three Black Crows formation should be used as part of a broader trading and risk-management framework, not as a guaranteed signal or a personalised recommendation.
Advanced Tips for Trading the Three Black Crows Pattern
- Use the pattern within a broader framework: Advanced traders often use the Three Black Crows pattern as part of a complete trading plan, rather than treating it as a standalone signal.
- Apply multi-timeframe analysis: Multi-timeframe analysis may provide better context. For example, if the pattern appears on a daily chart, traders may check the weekly chart to understand the broader trend and then use a lower timeframe to refine entry planning.
- Compare performance across asset classes: The setup may appear across different asset classes, including stocks, indices, forex, commodities, and crypto. However, reliability varies by asset, session, liquidity, and volatility.
- Be cautious in crypto markets: In crypto markets, the pattern may suggest possible bearish pressure, but high volatility can create false signals.
Psychological Aspects of Trading Bearish Reversals
Trading bearish reversals after a strong uptrend can be psychologically difficult. Some traders hesitate to exit long positions because they are anchored to previous highs. Others fear missing out if the market continues higher.
There is also a tendency to ignore bearish evidence when a trader already has a bullish view. This can lead to holding losing positions for too long or entering late after the price has already fallen sharply.
The technical pattern is only one part of the decision. Discipline, emotional control, and predefined risk rules are just as important.
FAQs
Is the Three Black Crows pattern reliable for all timeframes?
The Three Black Crows pattern can appear on any timeframe, but it is not equally reliable across all charts. Higher timeframes such as daily or weekly charts may reduce market noise and provide clearer signals. Shorter timeframes may create more frequent setups, but they can also produce more false signals, so confirmation remains important.
What comes after a Three Black Crows pattern?
After a Three Black Crows pattern, price may continue lower if sellers maintain control and the move is confirmed by support breaks or bearish momentum. However, the setup can fail if price reaches strong support, becomes oversold, or reacts to unexpected news. Traders should monitor follow-through instead of assuming automatic downside continuation.
How do you differentiate Three Black Crows from other bearish patterns?
The Three Black Crows pattern is identified by three consecutive bearish candles appearing after an uptrend, with each candle generally closing lower than the previous one. Other bearish patterns, such as Bearish Engulfing or Dark Cloud Cover, usually involve one or two candles and have different structures, so traders should compare both context and candle formation.
Can the Three Black Crows pattern be used in Islamic or Swap-Free accounts?
The Three Black Crows pattern is only a technical analysis tool, so it can appear on charts used by different account types. However, Sharia compliance depends on the instrument, ownership structure, leverage, fees, execution, and account conditions. A Swap-Free account does not automatically guarantee compliance, so traders should seek qualified guidance when needed.
Why do many retail traders struggle to profit from patterns like Three Black Crows?
Many retail traders struggle because they treat patterns like guaranteed signals instead of probability-based tools. They may enter without confirmation, use excessive leverage, ignore support and resistance, or trade emotionally after the move has already happened. A pattern can help analysis, but it cannot replace risk management, discipline, and a complete trading plan.