
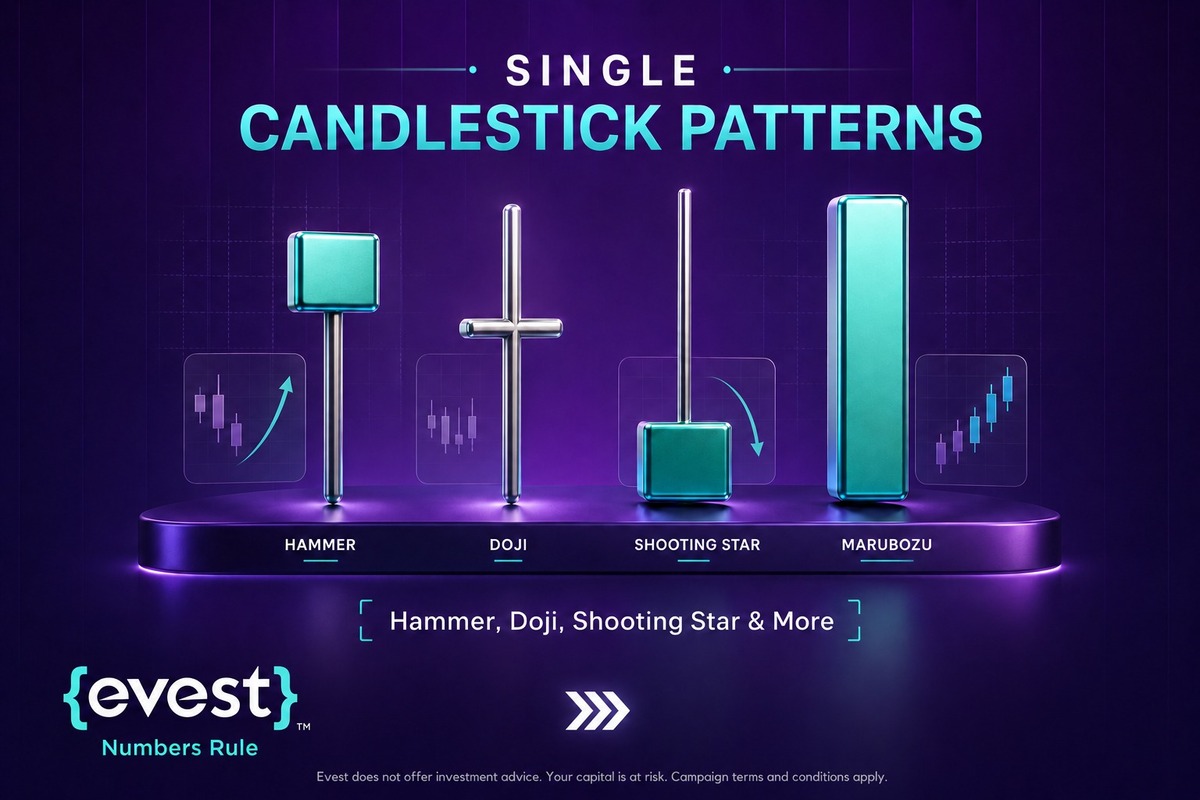
Single candlestick patterns are individual price formations that may help traders identify buying pressure, selling pressure, price rejection, momentum, or market indecision.
However, the shape of a candle does not provide a complete trading signal on its own. Its meaning depends on where it appears, the trend that preceded it, nearby support and resistance levels, the selected timeframe, and whether the following price action confirms the signal.
In this Evest guide, you will learn how the main bullish, bearish, and indecision candlestick patterns are formed, what they may indicate, and how traders can evaluate them within a broader risk-managed trading plan.
How to Read a Single Candlestick?
Each candlestick contains four price points:
- Open: the price at the beginning of the selected period.
- High: the highest price reached during that period.
- Low: the lowest price reached during that period.
- Close: the price at the end of the period.
The area between the opening and closing prices is called the real body. A long body may indicate stronger directional momentum, while a small body may indicate reduced momentum or indecision.
The lines above and below the body are known as wicks or shadows. A long upper wick shows that price moved higher before being pushed back down. A long lower wick shows that price moved lower before recovering.
Timeframe also affects interpretation. A pattern on a daily chart represents more trading activity than the same pattern on a one-minute chart, although no timeframe makes a pattern automatically reliable.
Visual requirement: Add an annotated candlestick diagram showing the Open, High, Low, Close, real body, upper wick, and lower wick.
The Foundation of Price Action Body, Shadows, Color, and Timeframe
A single candlestick has a real body and shadows, also known as wicks. The real body shows the distance between the opening and closing prices. A large body usually reflects stronger directional movement, while a small body often reflects hesitation or indecision.
The upper shadow shows the highest price reached during the period, while the lower shadow shows the lowest price reached. Long shadows often suggest price rejection at extreme levels.
The candle color shows whether the session closed higher or lower than it opened. A bullish candle usually means the close was above the open, while a bearish candle means the close was below the open.
The timeframe is also important. A Hammer on a daily chart may carry more weight than a Hammer on a one-minute chart because the daily candle reflects a larger period of market behavior.
What Can a Candlestick Reveal About Market Behaviour?
Candlesticks convert price movement into a visual summary of the interaction between buyers and sellers during a specific period.
A long bullish body may indicate that buyers maintained control into the close, while a long bearish body may indicate stronger selling pressure. Long wicks show that price reached an extreme but failed to remain there before the candle closed.
A Doji may reflect temporary balance between buyers and sellers. A Hammer may show that sellers pushed price lower before buyers recovered much of the decline. A Marubozu may reflect strong directional momentum because it forms with little or no wick.
These interpretations describe what happened during the candle period. They do not confirm what the market will do next, which is why traders normally assess the surrounding trend, price levels, liquidity, and subsequent candles.
Key Bullish Candlestick Patterns and Their Trading Implications
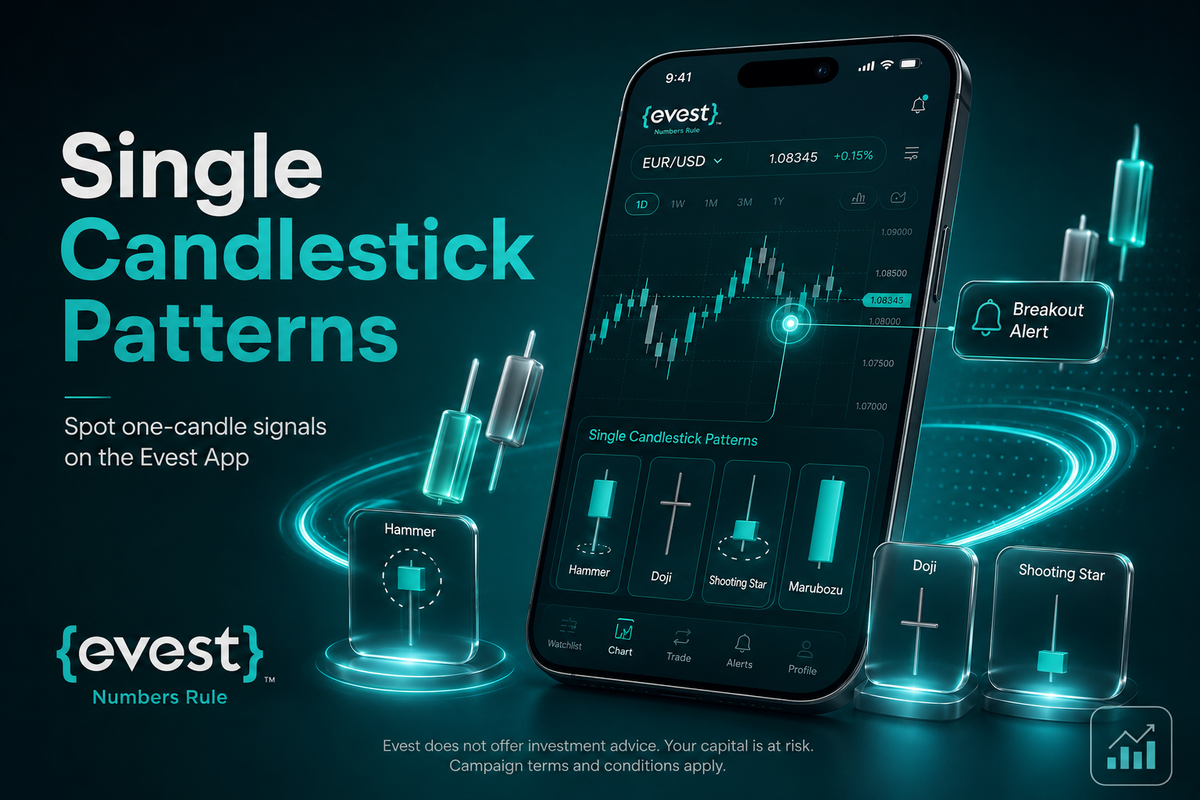
Bullish single candlestick patterns may suggest potential upward movement or reversal when confirmed by context. They are often more meaningful when they appear after a decline, near support, or after a period of selling pressure.
These candles do not guarantee a reversal. Instead, they show that buyers may be starting to defend a price area or challenge seller control.
The Hammer A Potential Bullish Reversal Pattern
The Hammer is a potential bullish reversal pattern, especially when it appears near support after a downtrend. It has a small real body near the top of the candle, a long lower wick, and little or no upper wick. The long lower shadow shows that sellers pushed price down during the session, but buyers managed to push it back up before the close.
The following example is hypothetical and for illustration only: if EUR/USD is moving lower and forms a Hammer near a known support level, some traders may watch the next candle for confirmation before considering a bullish setup.
A Hammer alone is not enough. Traders often wait for a confirmation candle, a reaction from support, or a break above a short-term resistance level before entering.
The Inverted Hammer Early Sign of Possible Buying Interest
The Inverted Hammer is another potential bullish reversal candle. It usually appears after a downtrend and has a small real body near the bottom of the candle with a long upper wick.
This candle shows that buyers tried to push price higher during the session, but sellers pushed it back down near the open. That means buyers appeared, but they did not fully control the close.
Confirmation is important because the long upper wick also shows that sellers rejected higher prices during the session. The pattern becomes more useful if the next candles show stronger buying follow-through.
The Bullish Marubozu Strong Buying Pressure
The Bullish Marubozu is a strong momentum candle that may indicate buying pressure. It has a long bullish body with little or no upper or lower wick.
This structure suggests that buyers controlled most of the session, with the price opening near the low and closing near the high. It may appear during a breakout, a continuation move, or the early stage of a bullish reaction.
For example, if USOIL forms a Bullish Marubozu after consolidation, it may suggest stronger buying pressure. However, traders should still confirm the move with trend direction, resistance levels, volume, and broader market conditions.
The Dragonfly Doji Rejection of Lower Prices
The Dragonfly Doji forms when the open, high, and close are very close to each other, while the candle has a long lower wick.
This pattern may suggest rejection of lower prices, especially when it appears after a decline or near a support area. Sellers pushed price down, but buyers managed to bring it back near the opening level before the candle closed.
However, the Dragonfly Doji requires confirmation from the next candles. Without follow-through, it may simply represent temporary hesitation rather than a true reversal.
Key Bearish Candlestick Patterns and Their Trading Implications
Bearish single candlestick patterns may suggest potential weakness when they appear after an uptrend, near resistance, or after an extended rally.
These patterns do not mean price must decline. They show that sellers may be challenging buyer control, but traders still need confirmation from price action, trend structure, support and resistance, or volume.
The Hanging Man Warning After an Uptrend
The Hanging Man has the same basic shape as the Hammer, but it appears after an uptrend. It has a small body near the top of the candle and a long lower wick.
The candle shows that sellers managed to push price lower during the session, even though buyers later pushed it back near the open. After a strong uptrend, this may warn that selling pressure is starting to appear.
It is more meaningful near resistance or after an extended uptrend. Context is important because the same candle shape can have a different meaning depending on where it appears.
The Shooting Star A Potential Bearish Reversal Signal
The Shooting Star is a potential bearish reversal signal that appears after an uptrend. It has a small real body near the bottom of the candle and a long upper wick.
This structure shows that buyers pushed the price higher, but sellers rejected those higher levels before the close. The longer the upper wick, the stronger the rejection may appear.
The following example is hypothetical and for illustration only: if XAU/USD reaches a new high and forms a Shooting Star near resistance, it may warn of weakening buying pressure, especially if followed by bearish confirmation.
The Bearish Marubozu Strong Selling Pressure
The Bearish Marubozu is a strong bearish momentum candle. It has a long bearish body with little or no upper or lower wick.
This candle suggests that sellers dominated most of the session, with price opening near the high and closing near the low. It may appear at the beginning of a downward move or as a continuation candle during an existing downtrend.
If a DFM-listed stock forms a Bearish Marubozu, it may indicate strong selling pressure. This is an illustrative example only, not a recommendation to trade any specific stock.
The Gravestone Doji Rejection of Higher Prices
The Gravestone Doji forms when the open, low, and close are close to each other, while the candle has a long upper wick.
This candle may suggest rejection of higher prices. Buyers pushed price higher during the session, but sellers brought it back down near the open before the close.
It becomes more relevant near resistance or after a prolonged uptrend. Like other single candlestick patterns, it should be confirmed by the next candles before being used in a trading decision.
Indecision Candles Doji and Spinning Top
Not every candlestick pattern signals a reversal. Some candles mainly show uncertainty.
The Doji forms when the open and close are very close. It reflects balance between buyers and sellers during the candle period. A Doji may appear during consolidation, after a trend, or near an important price level. It shows indecision; reversal depends on trend context and confirmation.
The Spinning Top is similar to the Doji candle but has a small real body. It also has upper and lower shadows, showing that price moved in both directions but closed near the open. Unlike a Doji, the Spinning Top has a visible body, but both patterns reflect uncertainty.
These candles become more meaningful when they appear at important support or resistance levels, or after an extended move.
How to Confirm a Single Candlestick Pattern?
Recognising a candle’s shape is only the first step. Traders also need to evaluate the market conditions in which it appears.
The following factors may help assess the strength of a candlestick signal:
Previous Trend
A reversal pattern should normally appear after a clear directional move. A Hammer after a decline has a different meaning from the same candle in the middle of a sideways range.
Support and Resistance
A bullish rejection candle near support may be more relevant than one that forms directly below major resistance. Similarly, a bearish rejection candle may carry more weight when it forms near resistance.
Higher Timeframe Structure
The broader timeframe can provide directional context. For example, a trader may use a daily chart to assess the main trend and an hourly chart to examine a potential entry.
Follow-Through
The candle that forms after the pattern can help confirm whether buyers or sellers are maintaining pressure. A bullish reversal pattern may be supported by a higher close, while a bearish pattern may be supported by a lower close.
Volume and Participation
When reliable volume data is available, increased activity near an important price level may support the interpretation. Volume should still be considered alongside price structure rather than used as confirmation in isolation.
Technical Indicators
Indicators such as RSI, MACD, or Stochastic may add supporting information, but they should not replace price action, market context, or risk management.
Candlestick patterns may help with trade timing, but they should not determine the entire trading decision.
Understanding the Limitations of Single Candlestick Patterns
Single candlestick patterns are useful visual tools, but their reliability varies.
They are often weaker in choppy markets, low-liquidity conditions, or during high-impact news events. They can also produce false signals if traders ignore broader market structure.
A common mistake is to see a Hammer and buy immediately, or see a Shooting Star and sell immediately, without checking trend, support and resistance, volume, and risk.
No single pattern is foolproof. Traders should use candlestick patterns as part of a broader process, not as a standalone system.
Risk Management for Candlestick-Based Setups
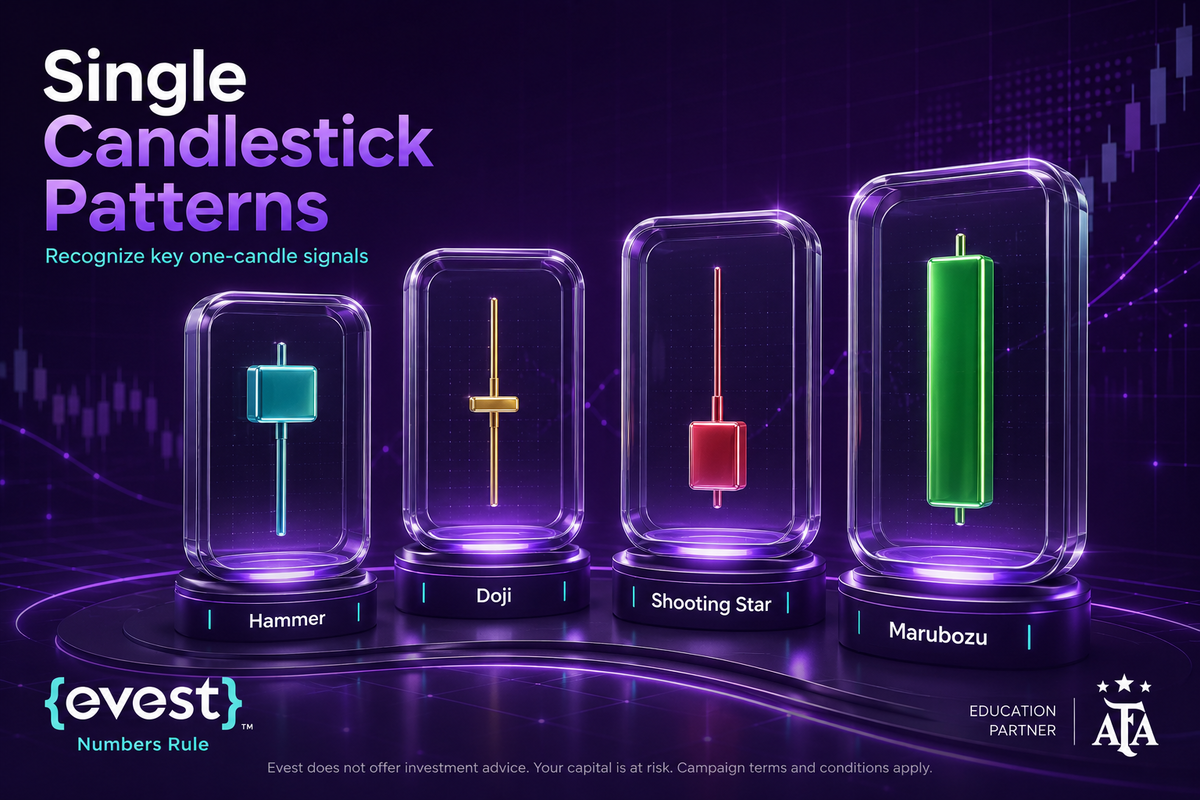
A candlestick pattern does not remove trading risk. Before evaluating any setup, traders should define where the original interpretation would become invalid.
For a bullish pattern such as a Hammer, the candle’s low may be used as a reference when identifying potential invalidation. For a bearish pattern such as a Shooting Star, the candle’s high may serve as a similar reference. The exact Stop Loss level depends on the strategy, volatility, market structure, and execution conditions.
Traders should also consider:
- The amount of capital at risk.
- The distance between the entry and invalidation levels.
- Position size.
- Available liquidity.
- Market volatility.
- Potential risk-to-reward.
- The effect of spreads, gaps, and slippage.
When leveraged products such as forex or CFDs are involved, losses may increase as quickly as potential gains. A valid pattern can still result in a significant loss if the position is too large or excessive leverage is used.
Stop Loss orders may help manage risk, but execution at the requested price is not guaranteed during gaps, fast-moving markets, or periods of limited liquidity.
Using Candlestick Patterns in Saudi and UAE Markets
Single candlestick patterns may appear across Saudi and UAE stocks, regional indices, commodities, forex pairs, and CFDs, depending on the instruments available through the trading platform.
Although the principles of candlestick analysis remain broadly similar, market-specific conditions can influence how a candle forms and how it should be interpreted. These conditions may include:
- Local trading sessions.
- Market liquidity.
- Bid-ask spreads.
- Daily price limits where applicable.
- Corporate announcements.
- Overnight economic or geopolitical developments.
- Differences between exchange-listed assets and leveraged derivatives.
For example, a Bullish Marubozu on a Saudi-listed stock may reflect strong buying pressure during that session, but the candle alone cannot explain the source or sustainability of that demand. A Shooting Star on a UAE-listed stock may show rejection of higher prices, but subsequent price action is still required to evaluate whether the rejection develops into a broader decline.
The instrument, exchange rules, product structure, and execution conditions should therefore be reviewed before applying any candlestick-based analysis.
All examples are provided for educational purposes and do not represent recommendations to trade a specific instrument.
Limitations and Common Candlestick Trading Mistakes
Single candlestick patterns provide visual information about price behaviour, but their reliability varies across markets, assets, timeframes, and trading conditions.
Signals may be less reliable during:
- Sideways or highly volatile markets.
- Periods of limited liquidity.
- Major economic announcements.
- Sudden gaps.
- Irregular trading activity.
- Conditions where reliable volume data is unavailable.
There is no fixed success rate that applies to a Hammer, Doji, Shooting Star, or any other pattern in isolation. The outcome depends on market context, confirmation criteria, execution, and risk management.
Common mistakes include:
- Entering immediately after recognising a candle shape.
- Ignoring the previous trend.
- Trading directly into major support or resistance.
- Treating indecision patterns as confirmed reversals.
- Using excessive leverage.
- Increasing position size after losses.
- Failing to define an invalidation level.
- Assuming that every correctly identified pattern must succeed.
Candlestick analysis is therefore better used as one part of a structured trading process rather than as a standalone trading system.
Explore the Markets with Evest
Evest provides traders with access to a range of financial markets through a user-friendly trading environment supported by educational resources and market insights. After learning how single candlestick patterns are formed and interpreted, traders can use Evest’s charting tools to observe price action, compare different timeframes, and practise applying technical analysis within a structured risk-management approach. Candlestick patterns should always be evaluated alongside broader market conditions and should not be treated as guaranteed trading signals.
FAQs
What is the difference between bullish and bearish single candlestick patterns?
Bullish single candlestick patterns may suggest buying pressure or a possible upward reversal, especially after a decline or near support. Examples include the Hammer, Inverted Hammer, Bullish Marubozu, and Dragonfly Doji. Bearish patterns may suggest selling pressure after a rally or near resistance, such as the Hanging Man, Shooting Star, Bearish Marubozu, and Gravestone Doji. These signals indicate possibilities, not guarantees.
How do you identify a Hammer candlestick pattern?
A Hammer candlestick pattern has a small real body near the top of the candle, a long lower wick, and little or no upper wick. It usually appears after a decline and becomes more meaningful near a support level. The long lower wick shows rejection of lower prices, but traders often wait for the next candle to confirm buying interest.
Are single candlestick patterns enough for making trading decisions?
Single candlestick patterns are not usually enough for making reliable trading decisions on their own. They can provide useful clues about market sentiment, but they should be confirmed with trend direction, support and resistance, volume, and higher timeframe structure. Traders also need clear risk management, proper position sizing, and an invalidation level before entering any trade based on a candle signal.
Which single candlestick pattern indicates strong market indecision?
The Doji is one of the clearest single candlestick patterns for market indecision. It forms when the open and close prices are very close, showing that neither buyers nor sellers had clear control during the candle period. A Spinning Top can also reflect uncertainty, but it has a small visible body, while the Doji has almost no real body.
How can I improve the accuracy of single candlestick pattern signals?
To improve the accuracy of single candlestick pattern signals, traders should avoid using the candle shape alone. A signal becomes stronger when it aligns with trend direction, support and resistance, volume, higher timeframe structure, and relevant market conditions. It is also important to define the invalidation level, use suitable position sizing, and manage risk before entering the trade.