
Silver price forecast in the final months of 2026 with a much more complex outlook than the simple bullish story that dominated early in the year. After reaching record territory in January, the metal corrected sharply and was trading near $64.54 on September 11. Investors are now balancing higher-rate expectations, a stronger dollar risk, persistent market deficits, resilient physical investment, and softer photovoltaic demand. This silver price forecast reviews short-term XAG/USD levels, institutional targets, industrial demand, supply, recycling, the gold-silver relationship, and scenarios for 2027 and 2030 to explain what could move prices next from here over the coming years.
Silver Price Forecast 2026 Quick Answer
The short-term silver outlook is mixed rather than decisively bullish. Reuters reported spot silver at $64.54 per ounce on September 11 after a volatile week in which stronger U.S. inflation data lifted expectations for another Federal Reserve rate increase. That matters because silver is a non-yielding asset. When bond yields rise and the dollar strengthens, the opportunity cost of holding precious metals increases. At the same time, silver continues to receive support from physical-market tightness, investment demand, and a structural supply deficit.
For the rest of 2026, institutional forecasts remain unusually dispersed. J.P. Morgan expects silver near $63 in the fourth quarter and an average of $70 for the full year, while selected LBMA survey participants published much wider ranges. That disagreement is important. The market is not trading around one clean consensus target. A more useful base case is that silver remains volatile around the low-$60s to low-$70s unless rates, the dollar, or physical supply conditions create a stronger directional move.
Current Silver Price and Market Position
Silver’s market position changed dramatically during 2026. After ending 2025 near record levels, the metal reached an intraday high above $120 in January before reversing sharply. Capital.com data show silver falling toward $58 in early April, recovering above $87 in May, dropping into the low-$50s by mid-June, and then climbing back above $71 in late August. By September 11, Reuters reported spot silver at $64.54.
That history shows why a silver price forecast should not rely on a single target. The metal has experienced exceptionally large swings while moving between monetary, geopolitical, and industrial narratives. Silver can behave like gold when investors seek hard assets, but it can also respond like an industrial commodity when manufacturing demand weakens. The smaller size of the silver market can amplify both reactions, making range-based forecasts more useful than precise point estimates.
Silver Outlook for the Rest of 2026
The most important near-term question is whether silver stabilizes around the current mid-$60s area or resumes the decline that followed August’s rally. J.P. Morgan’s August outlook is cautious, forecasting $63 per ounce in Q4 2026 after reducing its earlier estimate. The bank expects a $70 full-year average and argues that unwinding physical tightness, possible rate hikes, and weaker photovoltaic demand can limit upside.
The bullish side of the market focuses on persistent deficits, investment demand, geopolitical uncertainty, and the possibility that physical liquidity tightens again. The Silver Institute expects the market to remain in deficit for a sixth consecutive year in 2026. That does not guarantee higher prices, because above-ground inventories can fill part of the gap and high prices can stimulate recycling. It does, however, mean the market has less room for a demand shock than a comfortably supplied market would have.
Short-Term Silver Price Forecast
For the next several weeks, silver is likely to remain sensitive to Federal Reserve expectations and the U.S. dollar. Capital.com’s September technical snapshot placed the 50-day simple moving average near $61.5, a classic pivot near $64.7, and the first major pivot resistance near $72.9. Those levels were calculated on September 1 and should be refreshed before publication, but they remain useful reference points for interpreting the current market.
A sustained move above the low-$70s would improve the short-term structure and suggest that August’s recovery is regaining strength. Failure to hold the low-$60s would make the June lows and lower technical support more relevant. The important point is not that one level predicts the future. Support and resistance define where the market’s behavior changes. If silver breaks a level with stronger volume and improving momentum, the probability of continuation increases. If it repeatedly fails, the forecast should be adjusted.
Silver Market Analysis and Forecast
The silver market currently reflects a conflict between macro pressure and structural support. On the macro side, U.S. inflation and higher-rate expectations have pushed bond yields higher and strengthened the case for restrictive monetary policy. Reuters reported that markets assigned an 87% probability to a Federal Reserve rate increase after the August consumer inflation report. Higher yields can weigh on silver by increasing the return available from interest-bearing assets.
On the structural side, the Silver Institute expects another annual market deficit, strong physical investment, and continued technology-related demand. This creates a market in which pullbacks can attract physical and investment buyers even while higher rates limit speculative upside. The result is a forecast that may remain volatile and two-sided rather than trending smoothly. A decisive breakout probably requires one side of that conflict to weaken, either through easier monetary conditions or through a larger slowdown in demand.
Silver Technical Levels to Watch
Technical analysis should be used as a framework for market behavior rather than a substitute for fundamental analysis. The September 1 Capital.com snapshot showed silver near its 20-day average, above the 50-day average, but below longer-term 100-day and 200-day averages. RSI was close to neutral and ADX was below the level many traders associate with a strong trend. That combination suggested consolidation rather than a confirmed directional move.
- Watch the low-$60s area because the 50-day moving average was near $61.5 in the early-September snapshot.
- Treat the mid-$60s as an active pivot zone rather than permanent support because silver has moved through it repeatedly.
- Monitor the low-$70s, especially around $72.9, as the first major upside technical reference from the September pivot structure.
- Use the upper-$70s as a secondary resistance zone only if momentum and volume strengthen after a breakout.
- Refresh moving averages, RSI, and pivot levels on the publication date because silver’s volatility can make ten-day-old signals obsolete quickly.
Factors Influencing Silver Prices
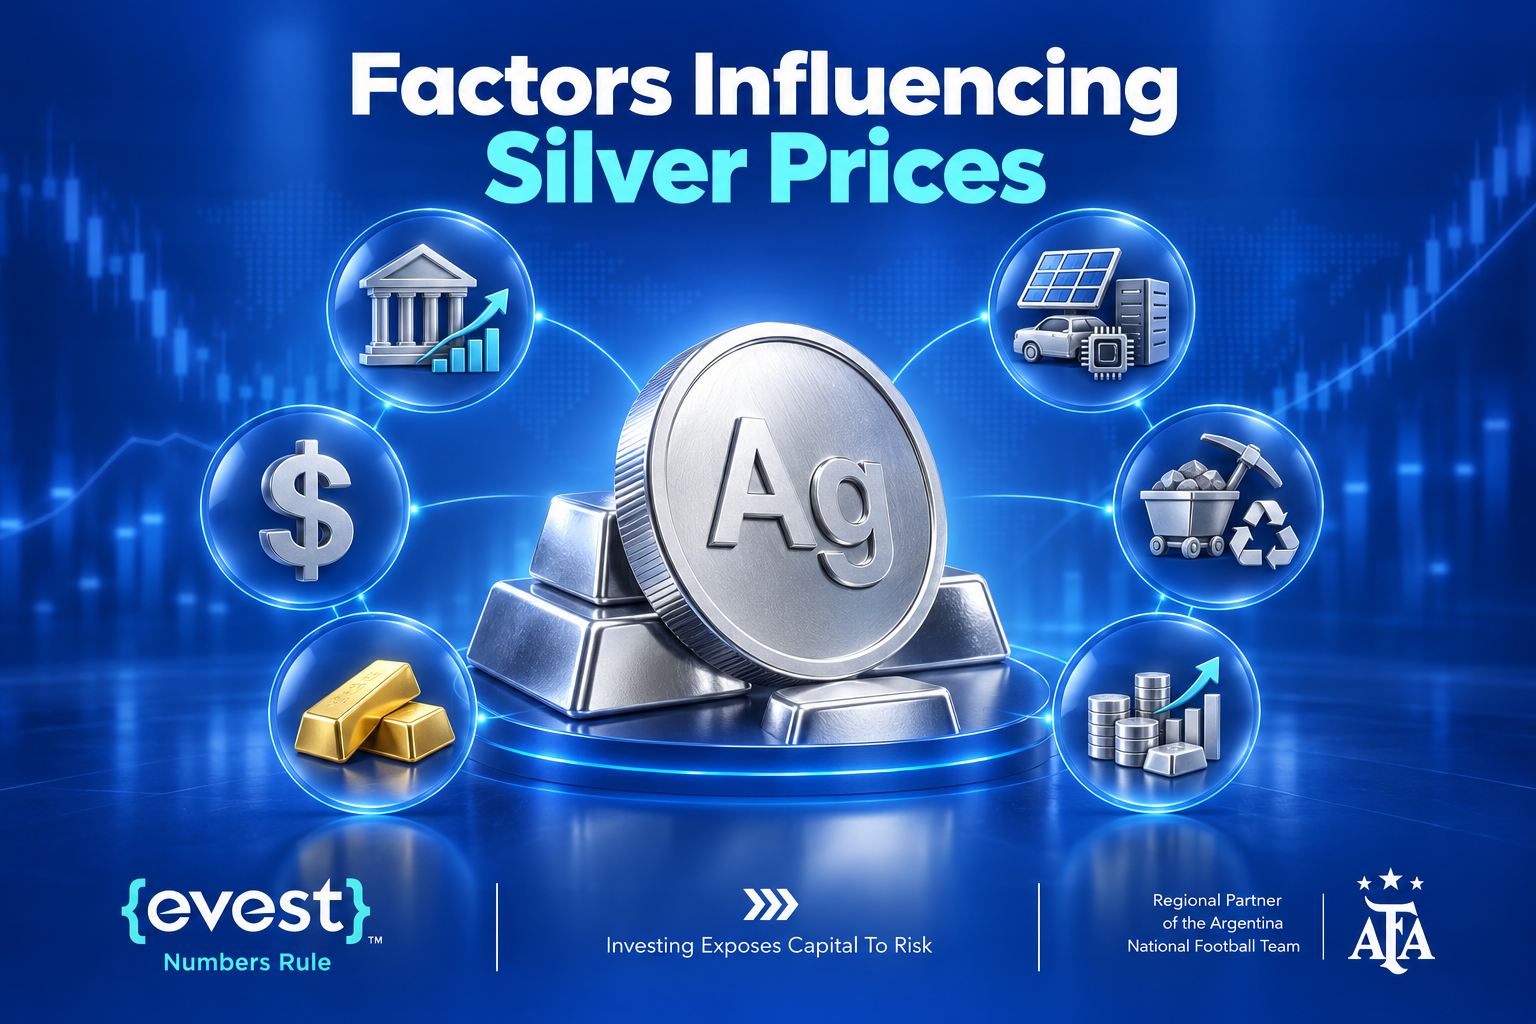
Silver’s price is driven by a wider mix of forces than many commodities because the metal has both monetary and industrial demand. The factors below should be connected directly to the forecast rather than treated as generic background information.
- Federal Reserve policy and real yields influence the opportunity cost of holding a non-yielding metal.
- The U.S. dollar affects silver because the metal is priced internationally in dollars.
- Gold direction matters because investor flows into precious metals often move across both markets.
- Industrial demand from solar, electronics, vehicles, data centers, and AI infrastructure supports physical consumption.
- Mine production, recycling, and above-ground inventories determine how easily supply can respond to demand.
- ETF, bar, coin, and futures flows can amplify price moves in a market that is smaller and less liquid than gold.
US Dollar Interest Rates and Gold Correlation
Silver often benefits from a weaker dollar because the metal becomes less expensive in other currencies, while a stronger dollar can create the opposite effect. Interest rates matter for a similar reason. When real yields rise, investors can earn more from cash and bonds, reducing the relative appeal of assets that do not pay interest. This relationship is one reason silver weakened when September rate-hike expectations increased.
Gold also influences silver because both metals compete for precious-metals investment demand. J.P. Morgan argues that silver’s price path continues to take cues from gold, while the gold-to-silver ratio has moved back toward more traditional levels after silver’s extreme early-2026 outperformance. Silver usually behaves with higher beta than gold, meaning the same macro catalyst can create larger percentage moves in silver in either direction.
Industrial Demand Solar Electronics and AI
Industrial demand remains one of silver’s most important long-term supports, but the 2026 picture is more nuanced than the simple claim that solar demand will always rise. The Silver Institute expects industrial fabrication to decline by 2% in 2026 to around 650 million ounces. The main reason is the photovoltaic sector, where manufacturers are reducing the amount of silver used per cell and substituting other materials where possible.
At the same time, several technology sectors continue to create demand. Data centers, AI-related equipment, automotive electronics, power infrastructure, and other high-conductivity applications still depend on silver’s electrical and thermal properties. The industrial forecast therefore contains both a structural growth story and a price-elasticity problem.
- Solar installations can keep expanding even while silver use per panel falls.
- AI and data-center growth can support electronics demand but may not fully offset photovoltaic thrifting.
- Automotive electrification increases the number of electronic components that use conductive materials.
- High silver prices encourage manufacturers to redesign products and reduce metal intensity.
- Industrial demand becomes more bullish for price when usage growth outpaces substitution and efficiency gains.
Silver Supply Deficit Mining and Recycling
The supply side remains supportive but not one-directional. The Silver Institute forecasts total silver supply rising by 1.5% in 2026 to about 1.05 billion ounces. Mine production is expected to increase by roughly 1% to 820 million ounces. Even with that growth, the market is forecast to record a deficit of around 67 million ounces, marking a sixth consecutive annual shortfall.
The balancing mechanism is above-ground inventory and recycling. Recycling is projected to increase by 7% and exceed 200 million ounces for the first time since 2012 as high prices encourage holders to sell scrap. This matters because a deficit does not mean the market immediately runs out of metal. Inventories and recycled supply can absorb part of the imbalance. The bullish case becomes stronger when deficits persist while available inventory falls and recycling cannot respond fast enough.
Physical Investment and ETF Demand
Investment demand is another major variable. The Silver Institute expects physical investment to increase by 20% in 2026 to around 227 million ounces, reversing several years of weakness. Bar and coin buying can tighten the physical market, especially when geopolitical uncertainty or inflation concerns increase demand for hard assets.
Exchange-traded products and futures positioning can move even faster than physical investment. Strong ETF inflows can reinforce a rally, while withdrawals can weaken price despite a supportive supply-demand balance. Futures positioning also matters because crowded speculative trades can unwind quickly. January’s dramatic reversal after silver moved above $100 showed how rapidly an investment-driven move can change when liquidity and positioning shift.
Gold to Silver Ratio Outlook
The gold-to-silver ratio compares how many ounces of silver are required to buy one ounce of gold. It is not a valuation law, but it can help explain relative strength. When silver outperforms gold, the ratio falls. When gold is stronger, the ratio rises. The Silver Institute noted that the ratio moved below 50 during silver’s January surge, while J.P. Morgan later highlighted a return toward more traditional levels as silver corrected.
A falling ratio can support a bullish silver narrative when it reflects genuine investment and industrial demand. However, using an assumed historical ratio to generate a price target can create false precision. The ratio changes with monetary conditions, industrial cycles, and investor preferences. It is better treated as a relative-strength indicator than as proof that silver must return to a particular multiple of gold.
What Major Analysts Are Forecasting for Silver?
Institutional forecasts vary widely because analysts are using different assumptions about rates, physical tightness, investment demand, and industrial consumption. The table below compares dated forecasts rather than presenting a false consensus.
| Source | Forecast or Range | Time Frame | Key View |
| J.P. Morgan | $63 in Q4 2026, $70 average in 2026, $63 average in 2027 | 2026 to 2027 | Physical tightness unwinding and higher-rate risk limit upside |
| TD Securities via LBMA | $42 to $86 range, $44.25 average | 2026 | High prices and improving inventories can drive a correction |
| LSEG analyst via LBMA | $54 to $108 range, $69 average | 2026 | Supply concerns and green-technology demand support volatility |
| Standard Chartered via LBMA | $50 to $105 range, $79 average | 2026 | Physical supply tightness and undersupply remain supportive |
The spread between these forecasts is more informative than any single number. It shows that the market’s outcome depends heavily on assumptions. If rates remain high and industrial consumption softens, lower forecasts become more plausible. If investment demand strengthens while physical inventories tighten, the upper part of the forecast range becomes more realistic. Forecasts should therefore be updated when the assumptions behind them change.
Silver Bull Base and Bear Scenarios
A scenario framework makes the 2026 outlook easier to interpret than a single target. The ranges below are planning zones based on current market levels, institutional forecasts, and the main macro and physical drivers.
| Scenario | Indicative Zone | Conditions That Support It | What Would Weaken It |
| Bullish | $75 to $95+ | Lower yields, softer dollar, strong gold, renewed physical tightness, strong ETF flows | Hawkish Fed, weaker investment demand, rising recycling |
| Base Case | $58 to $75 | Mixed macro conditions, persistent deficit, stable investment demand, softer industrial growth | Breakout above resistance or sustained drop below physical support |
| Bearish | $45 to $58 | Higher rates, stronger dollar, industrial demand destruction, inventory normalization | Fast policy easing, renewed shortage, strong safe-haven buying |
Silver Price Forecast for 2027
The 2027 outlook remains uncertain because silver will move through additional central-bank decisions, industrial cycles, and changes in physical supply before then. J.P. Morgan currently forecasts an average of $63 per ounce in 2027, implying that the bank expects the 2026 correction to leave a more balanced market rather than a return to January’s extreme levels.
A stronger 2027 outcome would require persistent deficits, slower recycling growth, stronger investment demand, and easier monetary conditions. A weaker outcome could develop if industrial users continue reducing silver intensity, high prices keep jewelry demand depressed, and mine supply responds. The forecast should therefore focus on the balance between investment demand and demand destruction. A market deficit is supportive, but it does not eliminate the possibility of lower prices when financial demand weakens.
Silver Price Forecast for 2030

Forecasting silver to 2030 involves much more uncertainty than a one-year outlook. The long-term bullish case rests on electrification, grid investment, electronics, AI infrastructure, limited mine-supply responsiveness, and the possibility of recurring physical deficits. The bearish case is that higher prices accelerate substitution, recycling, and new supply while industrial efficiency reduces silver use per unit of output.
For that reason, long-term numbers should be presented as scenarios rather than promises. A sustained move above 2026’s high levels would require strong financial demand and a physical market that remains tight despite supply responses. A lower path is possible if technology reduces silver intensity faster than new applications increase total consumption. The key 2030 question is not whether silver reaches one headline price, but whether structural demand continues to outrun adaptable supply.
What Could Support a Stronger Silver Rally?
A stronger bullish case would require several conditions to improve together rather than one isolated catalyst.
- Federal Reserve expectations become less restrictive and real yields decline.
- The U.S. dollar weakens, improving precious-metals demand outside the United States.
- Gold remains strong and investment flows rotate into silver as a higher-beta precious metal.
- ETF, bar, and coin demand rises while London and other physical inventories tighten.
- Industrial demand from electronics, AI, automotive, and power infrastructure offsets photovoltaic thrifting.
- Recycling and mine supply fail to expand fast enough to close the annual market deficit.
Risks to the Silver Forecast
Silver remains highly volatile, and the 2026 market has already shown how quickly an extreme rally can reverse. The most important risks are connected to both monetary policy and industrial demand.
- A Federal Reserve rate increase or prolonged high real yields could pressure non-yielding precious metals.
- A stronger U.S. dollar could reduce international demand and weigh on commodity prices.
- Photovoltaic thrifting and substitution could reduce industrial silver consumption faster than expected.
- High prices could accelerate recycling and release more metal back into the market.
- Weaker manufacturing or recession conditions could reduce electronics, automotive, and industrial demand.
- Speculative futures or ETF positions could unwind rapidly and amplify a correction even when physical fundamentals remain supportive.
These risks do not mean silver must fall. They define the conditions that would force the forecast to change. Investors and traders should update the outlook when rates, the dollar, industrial demand, or physical market conditions move materially away from the assumptions used in the current scenario.
Silver Price Forecast 2026 Final Outlook
Silver enters the final months of 2026 in a volatile but fundamentally supported position. The market remains in structural deficit, physical investment is expected to grow, and technology demand continues across several sectors. At the same time, higher-rate expectations, a stronger-dollar risk, photovoltaic thrifting, higher recycling, and improving supply create meaningful limits on the bullish case.
The short-term outlook therefore depends on whether silver can stabilize in the low-to-mid $60s and regain the low-$70s resistance area. J.P. Morgan’s $63 Q4 forecast shows that respected institutions still see downside or consolidation as plausible, while LBMA survey forecasts demonstrate substantial upside disagreement. The best approach is to treat silver as a scenario-driven market. Price, rates, the dollar, gold, physical inventories, industrial demand, and investment flows should determine when the outlook becomes more bullish or more cautious.
FAQs
Is silver expected to go up or down in 2026?
Silver could move in either direction during the rest of 2026. Persistent deficits and investment demand support prices, while higher interest rates, a stronger dollar, recycling, and softer photovoltaic demand could limit gains or trigger another meaningful correction in price.
What is the silver price forecast for the end of 2026?
J.P. Morgan forecasts silver near $63 per ounce in the fourth quarter of 2026. Other institutional views are considerably wider. The year-end outcome will depend on Federal Reserve policy, the dollar, physical supply, investment flows, and industrial demand conditions.
What factors influence silver prices the most?
Silver responds to interest rates, the U.S. dollar, gold, industrial demand, mine supply, recycling, physical inventories, ETF flows, and geopolitical risk. Because silver is both a precious and industrial metal, these forces can push prices in different directions simultaneously.
What is the silver price forecast for 2027?
J.P. Morgan currently forecasts an average silver price of $63 per ounce in 2027. Actual prices could differ substantially if monetary policy, industrial demand, physical inventories, recycling, or investment flows change from the assumptions used in current institutional forecasts.
Can silver reach $100 again?
Silver can trade above $100 again, as it did during the January 2026 surge, but a return is not guaranteed. It would likely require stronger investment demand, tighter physical supply, favorable monetary conditions, and renewed momentum across precious metals markets.