

Mass Index is a volatility-based technical analysis indicator developed by Donald Dorsey to identify market conditions that may precede a trend reversal. It measures the expansion and contraction of the distance between an asset’s high and low prices rather than price direction or momentum. Traders commonly monitor the reversal bulge signal, but it does not indicate whether the next move will be bullish or bearish. This guide explains the formula, calculation method, recommended settings, and how to interpret its signals alongside confirmation tools before making trading decisions.
What Is the Mass Index Indicator?
The Mass Index indicator tracks changes in the high-low trading range using two exponential moving averages. A rising reading reflects expanding price ranges, while a falling reading reflects contraction. The tool is designed to warn that an existing trend may be vulnerable to reversal, but it does not generate a complete buy or sell signal on its own. Traders still need price action, a moving average, or another directional tool to evaluate the possible direction of the next move.
Developed by Donald Dorsey, the indicator is based on the idea that a trend reversal may be preceded by an expansion in the trading range followed by contraction. This makes it a volatility-based indicator rather than a momentum, trend-following, or market breadth indicator.
How the Mass Index Differs from Other Volatility Indicators?
The tool approaches volatility differently from tools such as Average True Range and Bollinger Bands. ATR measures the magnitude of price movement, while Bollinger Bands show how far price has moved from a moving average. By comparison, the Mass Index examines the relationship between two smoothed versions of the high-low range and sums that relationship over a selected period.
This structure is intended to highlight changes in range behavior that may develop before a trend reversal. It does not identify the strength of buyers or sellers and does not determine the direction of a possible new trend.
Mass Index Formula and Calculation
The mass index calculation compares a 9-period EMA of the high-low range with a second 9-period EMA of that average. The resulting ratio is then summed over 25 periods. This mass index formula is designed to track how trading ranges expand and contract over time. The calculation does not measure price direction, momentum, or whether the next movement will be bullish or bearish.
The calculation steps are:
- Calculate the high-low range for each period by subtracting the low price from the high price.
- Calculate a 9-period EMA of the high-low range.
- Calculate another 9-period EMA of the first EMA.
- Divide the first EMA by the second EMA for each period.
- Add the ratios over the previous 25 periods to produce the final reading.
In simplified form:
Mass Index = Sum over 25 periods of: EMA (High − Low) ÷ EMA of EMA (High − Low)
Because the formula uses exponential moving averages, recent changes in the trading range have more influence than older observations. However, smoothing also means that the reading can lag behind price action.
Practical Example of Mass Index Calculation
Suppose the high-low range is 1.0, the 9-period EMA of that range is 0.90, and the second 9-period EMA is 0.85. The ratio for that period is approximately 1.058. This value is added to the previous 24 ratios to produce the 25-period Mass Index reading.
Reaching 27 alone does not complete the traditional reversal signal. The reversal bulge is completed only after the reading first rises above 27 and then subsequently falls below 26.5. The calculation updates with every new price period, so the signal can appear on different chart timeframes.
Mass Index Technical Analysis: How to Use Mass Index Signals
Learning how to use Mass Index signals starts with separating the volatility warning from the directional decision. A rising reading shows that high-low price ranges are expanding, while a falling reading shows that they are contracting. The main setup is a reversal bulge above 27 followed by a decline below 26.5.
After the setup completes, traders can examine price structure, moving averages, or another directional tool before evaluating a possible trading decision.
The main interpretations are:
- Reversal bulge: The main signal occurs when the reading rises above 27 and then falls below 26.5, warning that the existing trend may be vulnerable to a possible reversal.
- Volatility expansion: A rising value reflects widening trading ranges.
- Volatility contraction: A falling value reflects narrowing trading ranges.
- Directional confirmation: The signal should be evaluated with price action or another tool that can provide directional context.
The indicator should not be interpreted as an automatic instruction to open or close a position. It provides information about changing volatility conditions, not a guaranteed forecast.
The Mass Index Reversal Bulge
The mass index reversal bulge occurs when the 25-period reading rises above 27 and subsequently falls below 26.5. It suggests that a period of range expansion has been followed by contraction and that the existing trend may be vulnerable to reversal. However, the bulge is non-directional. It does not confirm whether the next movement will be upward or downward, and it does not guarantee that a reversal will occur.
A trader can therefore use the signal as an alert to reassess the current trend rather than as a standalone entry trigger. One traditional confirmation method is to monitor price relative to a 9-period moving average after the bulge completes. A move above the average may support a bullish interpretation, while a move below it may support a bearish interpretation. The confirmation should still be assessed within the wider market structure.
Integrating the Mass Index with Other Technical Analysis Tools
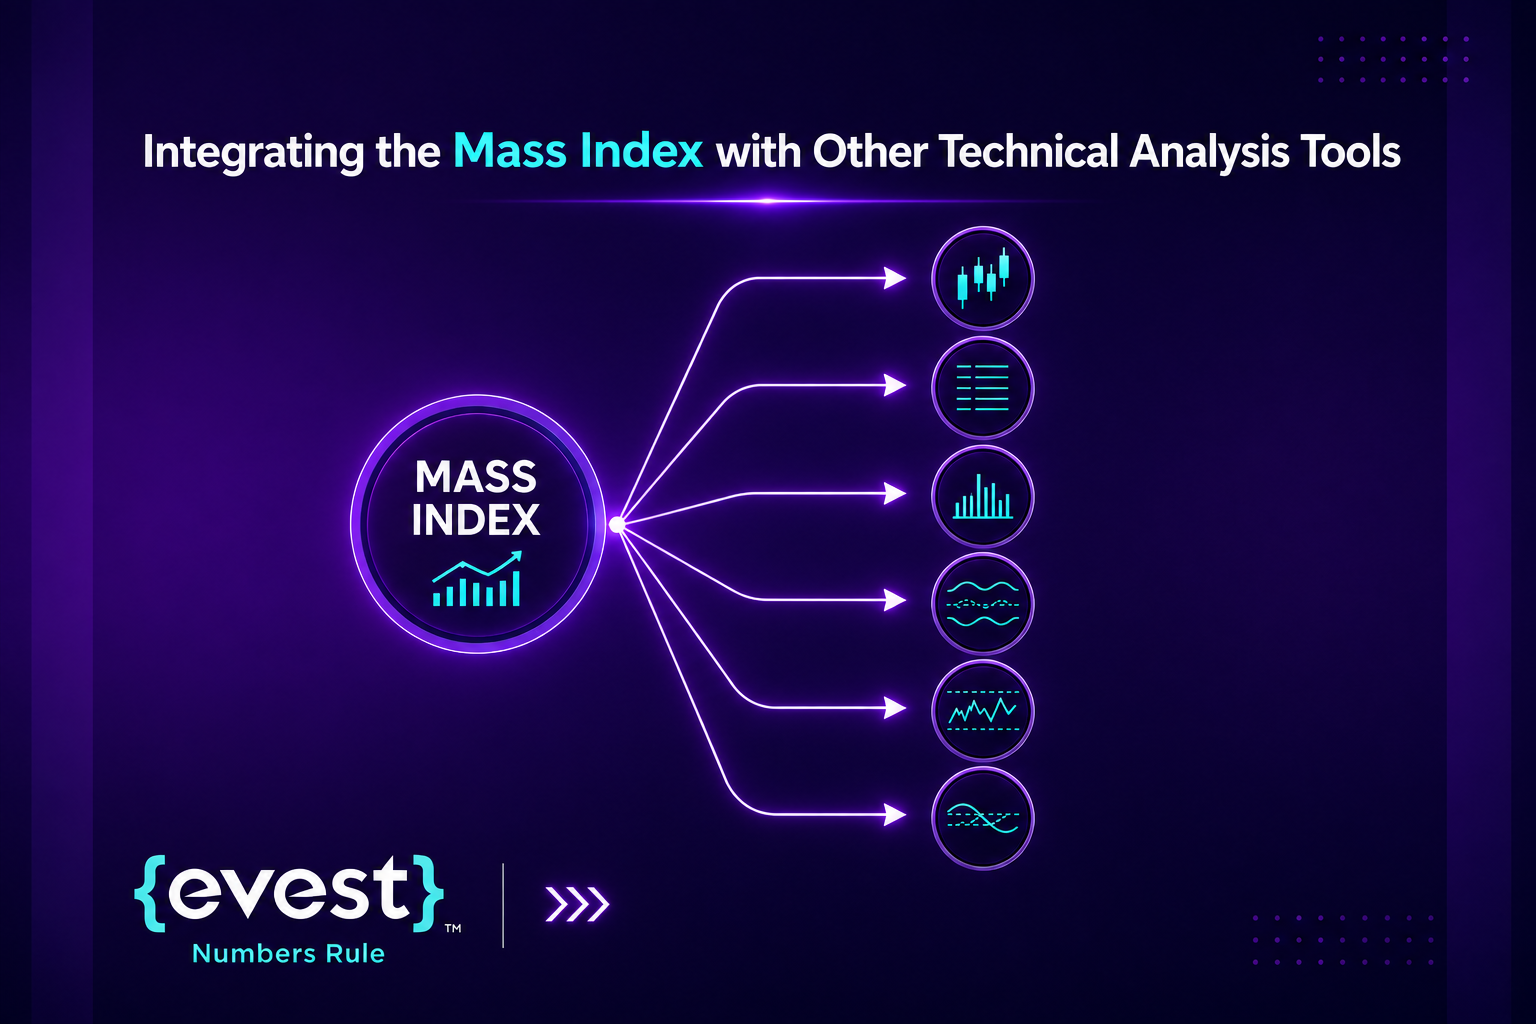
Combining the Mass Index indicator with directional and contextual tools can help traders evaluate whether a reversal warning is supported by the chart. The purpose of confirmation is not to remove risk, but to avoid treating one volatility reading as a complete decision-making system.
Useful forms of confirmation may include:
- Price action: A break of market structure or a validated reversal pattern can provide directional information.
- Moving averages: Price moving above or below an average can help assess the possible direction after the bulge.
- Support and resistance: A completed signal near an established level can provide context for monitoring price behavior.
- RSI or MACD: Momentum tools may help identify whether price conditions support a bullish or bearish interpretation.
- Volume data: Where reliable volume data are available, changes in activity can add context to a price move.
Traders should understand the source of the volume data they use. For example, spot forex does not have one centralized exchange volume feed, so platform volume may represent tick activity rather than the total volume of the global market.
Advantages and Limitations of the Mass Index Indicator
The Mass Index indicator can add a different perspective to chart analysis because it focuses on changes in the trading range. Its value depends on understanding both what it can show and what it cannot show before using it as part of a trading process.
Advantages
- Volatility insight: It shows the expansion and contraction of the high-low range.
- Potential early warning: The reversal bulge can alert traders that an existing trend may be vulnerable.
- Non-directional analysis: It does not assume in advance that the next move will be bullish or bearish.
- Flexible application: It can be applied to different assets and chart timeframes when reliable high and low data are available.
- Clear traditional thresholds: The 27 and 26.5 levels provide a defined setup for monitoring.
Limitations
- No directional signal: It cannot determine the direction of the next movement.
- False signals: A bulge may be followed by consolidation or continuation instead of reversal.
- Lag: The use of moving averages can delay the reading.
- Market-condition sensitivity: Strong trends, choppy markets, and low-liquidity instruments may produce less useful signals.
- Parameter sensitivity: Changing the periods can materially alter signal frequency.
- Confirmation required: It should not be used as a standalone decision tool.
Common Mistakes When Using the Mass Index
One common mistake is assuming that a reading above 27 is a completed signal. The traditional setup requires the indicator to rise above 27 and then fall below 26.5. Another mistake is assigning a bullish or bearish direction to the bulge itself. Direction must come from price behavior or another directional tool.
Traders may also react too early, ignore the existing trend, or use the same settings across every asset without testing how the indicator behaves. The indicator may also produce misleading readings in sideways or illiquid markets. In these conditions, erratic high-low ranges can create activity in the indicator without leading to a meaningful trend reversal.
Mass Index Trading Strategy
A practical mass index trading strategy should treat the reversal bulge as an alert rather than an automatic entry signal. The process begins by identifying the completed bulge, evaluating the existing trend, and waiting for separate directional confirmation. This approach reduces the risk of acting simply because the indicator crossed its traditional thresholds.
A structured example includes the following steps:
- Identify the completed bulge: Wait for the reading to rise above 27 and then fall below 26.5.
- Evaluate the existing trend: Determine whether the market was trending upward, downward, or moving sideways before the signal.
- Locate relevant price levels: Identify nearby support, resistance, or an established market structure.
- Wait for directional confirmation: Use a price break, a validated candlestick pattern, or a move above or below a 9-period moving average.
- Define invalidation: Identify the price level that would show that the trading idea is no longer valid.
- Plan risk and exit conditions: Determine position size, potential loss, and exit levels before taking any action.
This is an educational framework, not a guarantee of performance. Signals should be tested on historical data and reviewed under different market conditions before being used in a trading process.
Using the Mass Index Within Evest’s Educational Framework
For Evest readers, the Mass Index indicator should be viewed as one part of a broader technical analysis process rather than a standalone trading signal. Traders may use the mass index reversal bulge as an early warning, then compare it with price action, moving averages, support and resistance levels, and other technical indicators before evaluating a possible market setup.
The interpretation should also consider the selected asset, timeframe, prevailing market conditions, and the risks associated with leveraged trading. No technical indicator can predict market movements with certainty, which makes confirmation, testing, and risk management essential parts of the analysis.
FAQs
What Is the Primary Purpose of the Mass Index Indicator?
The primary purpose of the Mass Index indicator is to identify conditions that may appear before a trend reversal by measuring expansion and contraction in an asset’s high-low range. It is non-directional, so traders still need confirmation before making trading decisions.
How Does a Bulge Signal a Potential Reversal?
A reversal bulge occurs when the 25-period reading rises above 27 and then falls below 26.5. This shows that the trading range expanded and then contracted, warning that the current trend may be vulnerable to reversal, without confirming direction.
What Are the Default Mass Index Settings?
The default mass index settings use a 9-period EMA of the high-low range, a second 9-period EMA, and a 25-period sum. These settings are a starting point and should be tested on the selected asset and timeframe.
Does the Reversal Bulge Indicate Direction?
No. The mass index reversal bulge is non-directional. It does not show whether the next movement may be bullish or bearish. Traders need price action, moving averages, support and resistance, or another directional tool to assess the possible direction.
Can the Indicator Work in All Market Conditions?
No indicator works equally well in all conditions. The Mass Index may produce false or less useful signals in choppy, strongly trending, or low-liquidity markets. Market structure, confirmation, testing, and risk management remain important before using any signal.
Which Tools Can Be Combined With the Mass Index?
The Mass Index indicator can be combined with price action, moving averages, support and resistance, RSI, MACD, and reliable volume data. These tools may add context, but no combination removes trading risk or guarantees that a reversal will happen.