
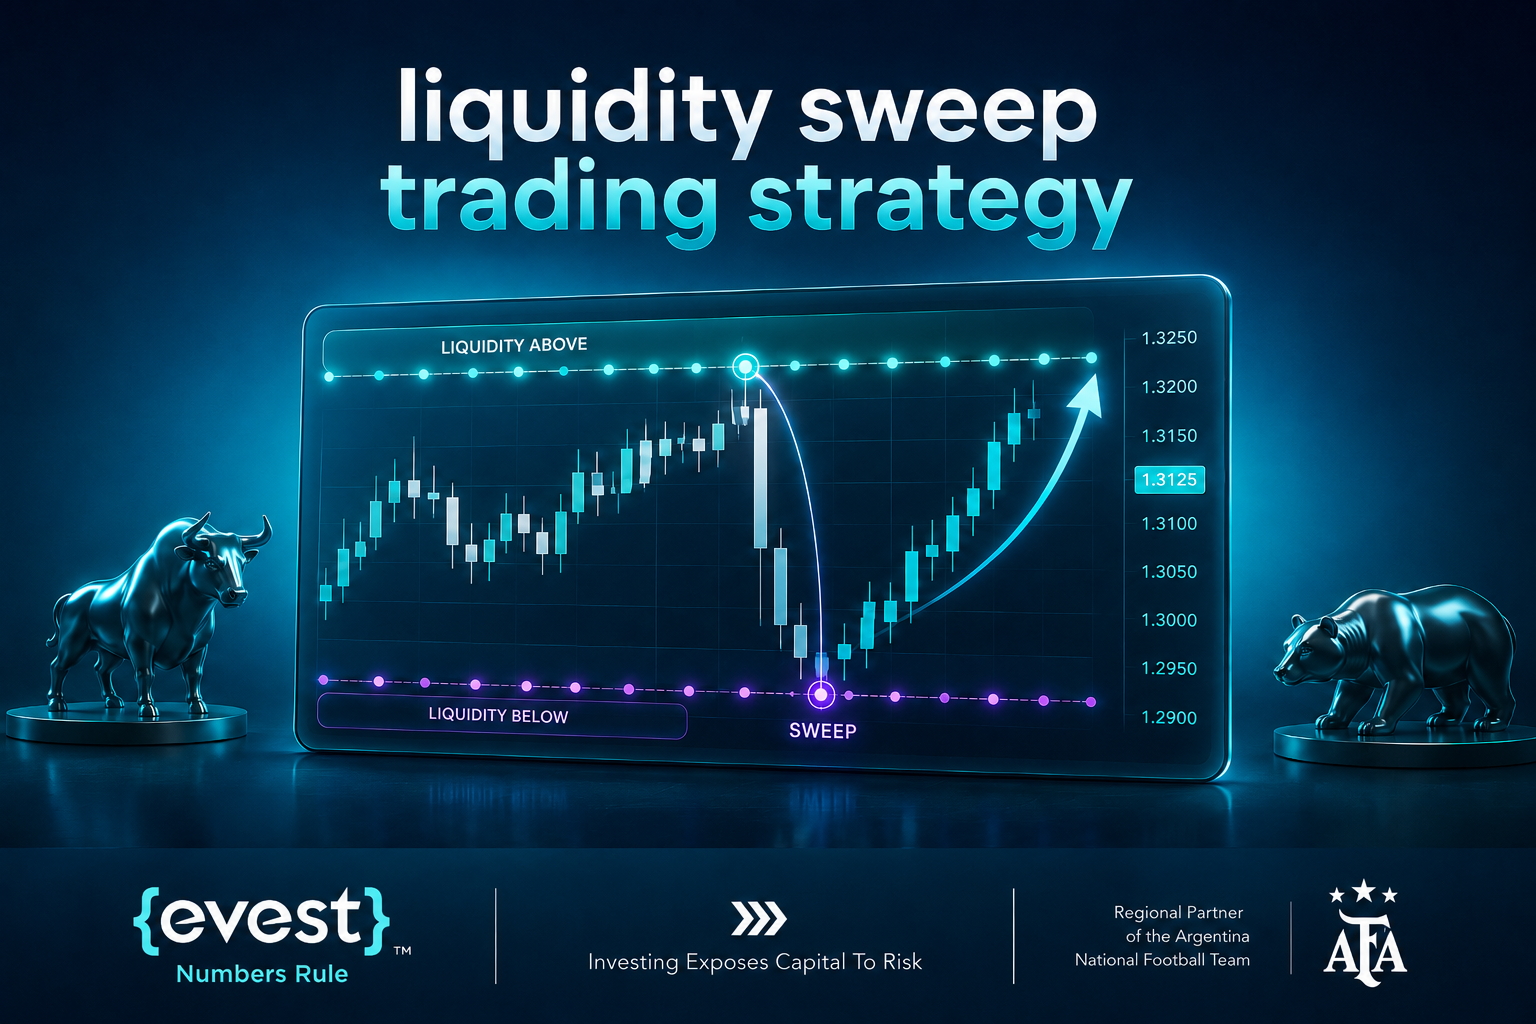
The liquidity sweep trading strategy is a price-action approach used to study what happens when price moves beyond an obvious high or low, interacts with clustered orders, and then returns through the level. Traders use the setup to evaluate liquidity, market structure, rejection, and possible reversal confirmation rather than assuming that every sharp move is caused by deliberate institutional manipulation. In this Evest educational guide, we explain how liquidity sweeps form, where traders look for them, how buy-side and sell-side liquidity differ, what supports entry confirmation, and key risks to consider when using the liquidity sweep trading strategy.
What Is a Liquidity Sweep in Trading?
A liquidity sweep occurs when price briefly trades beyond a level where orders are likely to be concentrated, such as a previous swing high or low, equal highs and equal lows, or a major support or resistance level, before rejecting the area and moving back through it.
These zones may contain stop-loss orders, breakout entries, and other pending orders. When price reaches them, the additional order flow can create a fast move through the level. If price quickly rejects the area afterward, traders may interpret the move as a potential liquidity sweep.
For example, EUR/USD may trade above a previous resistance level, trigger breakout buyers and stops from short positions, and then close back below that resistance. This can resemble a bearish liquidity sweep. However, the sweep alone does not guarantee that price will reverse.
Key Characteristics of a Liquidity Sweep
- A sharp move beyond an obvious high or low.
- Interaction with a visible liquidity zone.
- Rejection or a close back inside the previous range.
- A possible shift in short-term market structure.
- Stronger context when the setup aligns with higher-timeframe levels.
Defining Liquidity and Its Role in Markets
Liquidity describes how easily orders can be executed without causing a significant change in market price. In highly liquid markets, deeper order flow can generally support larger transactions with less price impact than in thinner markets.
When traders discuss institutional liquidity in forex, they are usually referring to the market depth and order flow available to banks, funds, liquidity providers, and other large participants. This is one reason liquidity-based traders pay attention to areas where many orders may be concentrated.
Common liquidity locations include:
- Previous swing highs and swing lows.
- Equal highs and equal lows.
- Established support and resistance.
- Session highs and lows.
- Range boundaries.
- Obvious breakout levels.
The Mechanics of a Liquidity Sweep
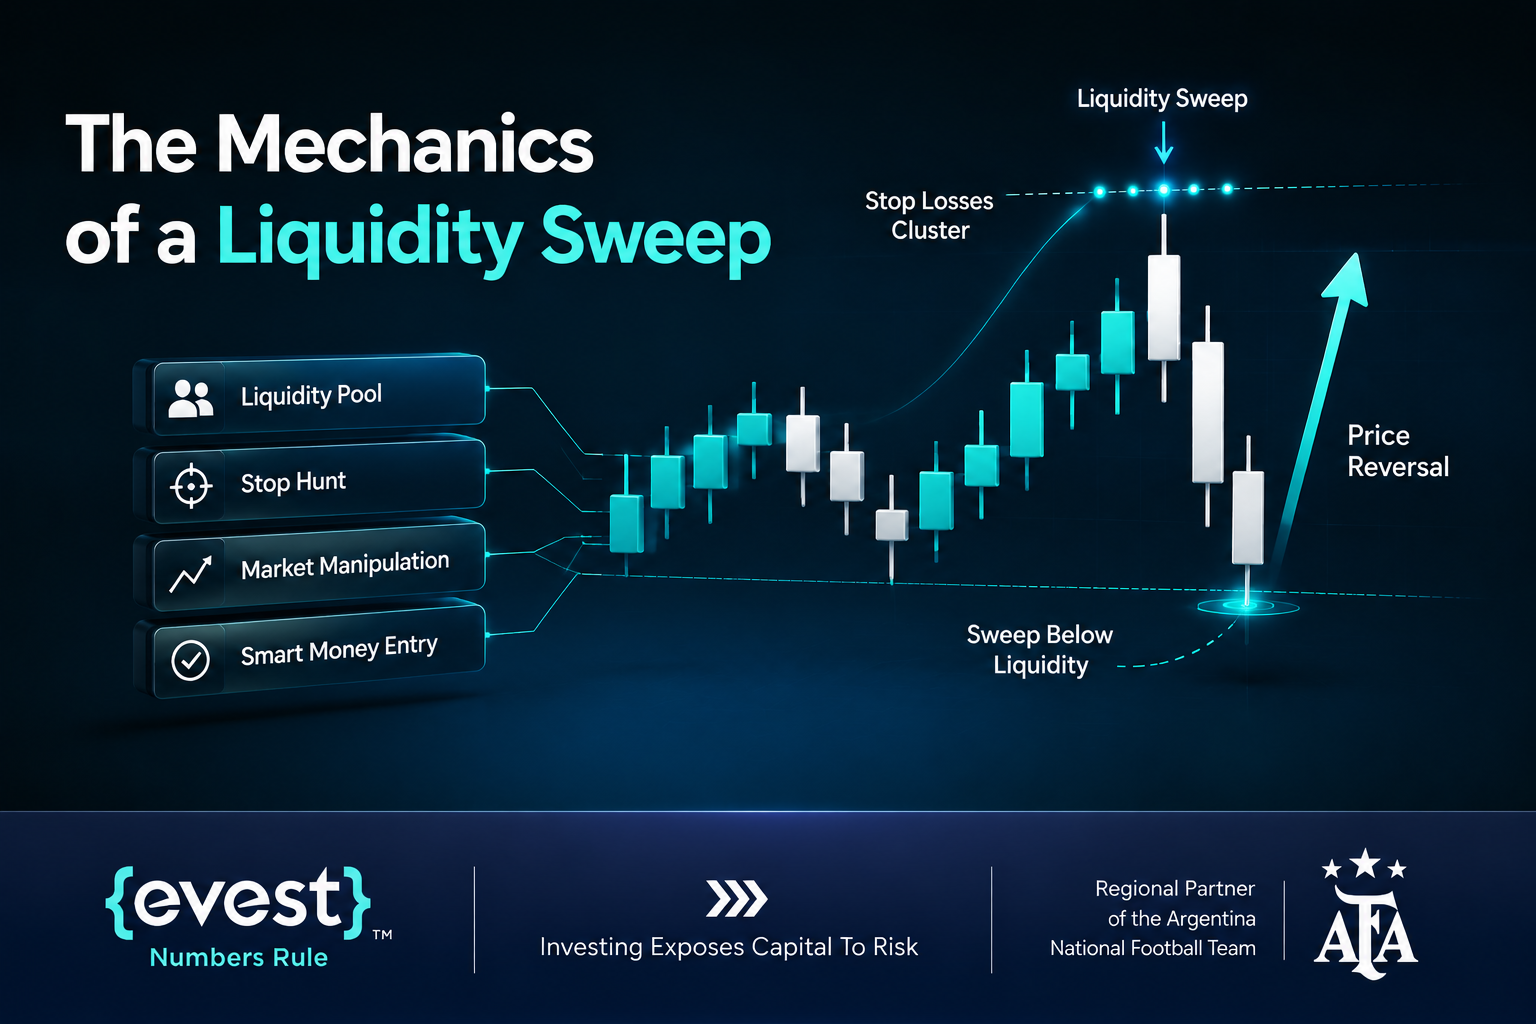
From an order-flow perspective, a liquidity sweep develops when price reaches an area where a concentration of stop-loss or pending orders may exist. Once price moves through that level, triggered orders can increase activity around the zone.
In liquidity grab trading and Smart Money Concept frameworks, traders often interpret this sequence as liquidity being taken before a possible move in the opposite direction. However, a chart cannot confirm the intention of a specific institution. The practical focus should therefore remain on observable price behavior.
A typical sequence may look like this:
- Price approaches an obvious liquidity zone.
- It briefly trades beyond the previous high or low.
- Orders around the level are triggered.
- Price rejects the area and moves back into the previous range.
- Traders wait for confirmation instead of entering immediately.
The final step is important. A move through liquidity can continue as a genuine breakout, so rejection and market structure matter.
Liquidity Sweep vs. Stop Hunt vs. False Breakout
| Term | Definition | Key Difference |
| Liquidity Sweep | A price move through an area where liquidity is concentrated, followed by a rejection from that area. | Focuses on liquidity and the price reaction after trading through the level. |
| Stop Hunt Strategy | A trader term describing a move through a level where stop-loss orders are believed to be clustered. | Assumes stop-loss orders are concentrated around a level, but the intention to target them cannot be proven from price action alone. |
| False Breakout | Occurs when price breaks an important technical level but fails to hold beyond it and returns to the previous range. | Focuses on the failure of the breakout and the return to the previous range; it is a broader concept. |
Identifying Liquidity Sweeps on Price Charts
The first step in learning how to identify liquidity zones is to mark areas where orders may naturally cluster. Previous highs and lows are a useful starting point, especially when a level is obvious to many market participants.
Equal highs can attract buy-side liquidity because breakout orders and stop losses from short positions may sit above them. Equal lows can attract sell-side liquidity because breakout sell orders and stops from long positions may sit below them.
After marking these areas, watch how price behaves when the level is breached.
Potential confirmation may include:
- A long wick through the level followed by rejection.
- A candle closes back inside the previous range.
- A strong opposite-direction candle after the sweep.
- A break of short-term internal structure.
- A retest of the swept level that fails to continue through it.
A breach alone is not enough. If price accepts above resistance or below support and continues building structure in the breakout direction, the move may be a genuine breakout rather than a liquidity sweep.
Indicators and Price Action for Liquidity Sweeps
Price action and market structure remain the main tools used to assess a potential sweep. There is no single liquidity sweep indicator that can confirm the setup on its own.
Some traders use RSI or MACD divergence to assess whether momentum is weakening while price makes a marginal new high or low. Volume tools may provide context about trading activity around the swept area, while Bollinger Bands can highlight unusually extended price movement.
These indicators should be treated as supporting information, not proof that a reversal is about to happen.
Buy-Side and Sell-Side Liquidity Pools
Understanding buy-side and sell-side liquidity is central to liquidity-based analysis.
- Buy-side liquidity generally forms above previous swing highs, equal highs, or resistance. These areas may contain stop losses from short positions and breakout buy orders.
- Sell-side liquidity generally forms below previous swing lows, equal lows, or support. These areas may contain stop losses from long positions and breakout sell orders.
A bearish sweep may occur when price moves above a buy-side liquidity area and then rejects it. A bullish sweep may occur when price trades below a sell-side liquidity area and then reverses back above it.
Bullish and Bearish Liquidity Sweep Examples
Liquidity sweeps occur when price briefly pierces key support or resistance levels to trigger stop orders and capture liquidity before reversing direction sharply:
Bullish Liquidity Sweep Example
Assume GBP/USD forms a visible support area near 1.2500. Price briefly trades below that level, reaches 1.2480, and then closes back above 1.2500.
If the next candles show bullish rejection and price breaks short-term structure to the upside, traders may classify the sequence as a bullish liquidity sweep.
Bearish Liquidity Sweep Example
Assume gold forms repeated highs near $2,000. Price trades above the equal highs, reaches $2,005, and then closes back below the prior resistance.
If bearish structure develops afterward, traders may interpret the move as a bearish sweep of buy-side liquidity.
These examples are hypothetical and are provided for educational purposes only.
Liquidity Sweep Entry Confirmation
Liquidity sweep entry confirmation should happen after price has interacted with and rejected the liquidity zone, not simply because a high or low has been breached.
When using a liquidity sweep trading strategy, traders commonly look for one or more of the following:
- A candle close back inside the prior range.
- A clear rejection candle.
- A break of internal market structure in the opposite direction.
- A retest of the swept level after rejection.
- Confluence with a higher-timeframe support, resistance, or liquidity area.
An aggressive approach may enter after the rejection candle closes. A more conservative approach may wait for a structural break and a retest.
Neither approach guarantees that the reversal will continue.
Common Stop-Loss and Take-Profit Approaches
Stop-loss placement should be connected to the point where the setup becomes invalid rather than placed at an arbitrary distance.
Common approaches include:
- Beyond the extreme of the sweep.
- Beyond a nearby structural high or low.
- Adjusted for the volatility of the instrument.
For profit targets, traders may look toward the next opposing liquidity area, a previous swing point, or another technically relevant level.
Risk-to-reward should be evaluated before the trade rather than after entry.
The important point is consistency: define the invalidation level, potential target, and position size before committing to the setup.
Combining Liquidity Sweeps with Order Blocks and Fair Value Gaps
In ICT-style analysis, an ICT liquidity sweep is often evaluated alongside concepts such as Order Blocks, Fair Value Gaps (FVGs), and market structure.
A trader may consider a sweep more meaningful when it occurs near a previously identified area and is followed by a clear rejection or structural shift.
For example, price may sweep a previous low, trade into a zone marked as an Order Block, and then break short-term structure upward.
Fair Value Gaps may also be used as areas of interest after a sweep, either as potential retracement zones or as possible targets depending on the broader setup.
These concepts can add confluence, but they do not prove institutional activity and do not make a reversal automatically high probability.
Avoiding Inducement and False Signals
One of the biggest mistakes in liquidity-based trading is treating every wick beyond a high or low as a valid sweep.
False signals are common when:
- The broader market is strongly trending.
- The supposed liquidity level is weak or insignificant.
- Price breaks the level and holds beyond it.
- Traders enter before any rejection appears.
- Lower-timeframe noise is analyzed without higher-timeframe context.
The practical solution is to combine location, rejection, structure, and context. If those elements do not align, the setup may not be worth treating as a liquidity sweep.
The Importance of Higher-Timeframe Context
A sweep on a lower timeframe can mean something very different depending on where it occurs within the larger structure.
For example, a 15-minute bearish sweep at a major daily resistance area may carry more context than the same pattern appearing in the middle of an unimportant intraday range.
Higher-timeframe analysis can help traders:
- Identify the dominant trend.
- Mark stronger support and resistance zones.
- Locate more visible liquidity pools.
- Filter some lower-timeframe noise.
- Avoid trading a small reversal against a much larger directional move.
The higher timeframe does not guarantee that a setup will succeed, but it can provide useful context for interpreting lower-timeframe price action.
How to Test a Liquidity Sweep Trading Strategy?
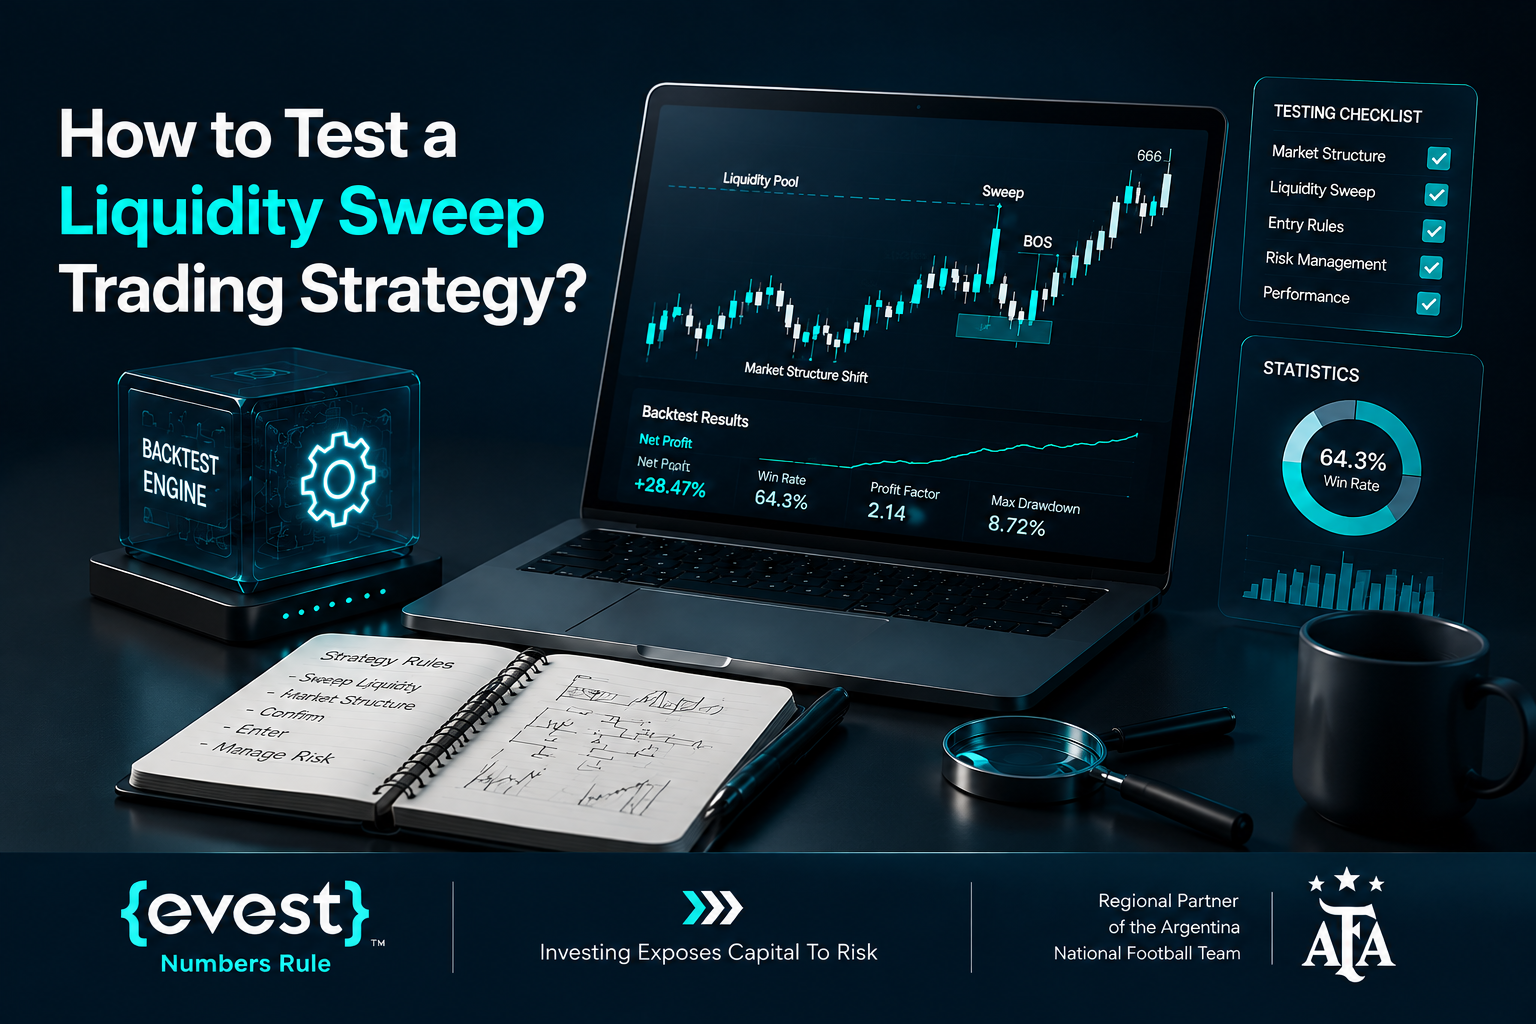
Before using the setup with real capital, traders can define clear rules and test them on historical or simulated data.
A structured process may include:
- Define what qualifies as a liquidity zone.
- Define what counts as a valid sweep.
- Choose the confirmation required before entry.
- Set invalidation and exit rules.
- Record the instrument, timeframe, session, and market conditions.
- Review a sufficiently large sample rather than judging the strategy from a handful of trades.
A demo environment can also help traders practice execution without relying on live capital.
Evest educational content encourages traders to understand the mechanics, risks, and limitations of a strategy before considering its practical use. Testing can help traders determine whether their rules are consistent, but historical results cannot predict future market performance.
Risk Management and Common Mistakes in Liquidity Sweep Trading
Liquidity sweeps can fail. A move through a liquidity zone may become a genuine breakout, or price may reverse temporarily and then continue in the original direction.
For that reason, risk management is an essential part of any liquidity sweep trading strategy.
Common mistakes include:
- Trading the sweep before confirmation.
- Using excessive leverage.
- Ignoring higher-timeframe structure.
- Chasing price after missing the planned entry.
- Placing stop losses without a clear invalidation level.
- Changing rules after entering a trade.
- Assuming a setup is reliable because it worked several times recently.
No individual pattern removes market risk. Historical and backtested results also do not guarantee future performance.
FAQs
How Does a Liquidity Sweep Differ From a Regular Breakout?
A regular breakout moves through a key level and continues to hold or build structure beyond it. A liquidity sweep typically trades through the level but then rejects it and returns to the prior range. Confirmation is important because the initial breach can look similar in both cases.
Can Liquidity Sweeps Be Used on Different Timeframes?
The concept can be studied across different timeframes, but the meaning of a sweep depends on context. Higher-timeframe levels may be more visible to market participants, while lower timeframes can contain more noise and more frequent signals.
What Is the Best Liquidity Sweep Indicator?
There is no single indicator that reliably identifies every liquidity sweep. Price action, liquidity zones, rejection, and market structure are usually the core elements. Momentum or volume indicators can provide additional context but should not be considered standalone confirmation.
Is the Liquidity Sweep Trading Strategy Suitable for Beginners?
The liquidity sweep trading strategy can be difficult for beginners because it requires an understanding of market structure, support and resistance, liquidity, confirmation, and risk management. Learning these foundations first can make the concept easier to evaluate and reduce the tendency to classify every false breakout as a liquidity sweep.
What Is the Most Important Confirmation After a Sweep?
There is no universal confirmation. Traders often look for a close back inside the range, a clear rejection, a break of internal structure, or a retest of the swept level. The confirmation should be defined as part of a consistent trading plan rather than changed from one setup to another.