
The Gold-Silver Ratio measures how many ounces of silver are needed to equal the value of one ounce of gold, helping traders compare the relative performance of both precious metals. Because gold and silver react differently to inflation, interest rates, industrial demand, and market uncertainty, the ratio can offer useful context for gold vs silver investing and broader market analysis. Traders following XAU/USD and XAG/USD on Evest can use the Gold-Silver Ratio as a supporting indicator, alongside price trends, volatility, macroeconomic conditions, and disciplined risk management before making trading decisions.
What Is the Gold-Silver Ratio and How Is It Calculated?
The Gold-Silver Ratio expresses the price of gold in terms of silver. If the ratio is 80:1, it means one ounce of gold has the same value as 80 ounces of silver.
The calculation is straightforward:
Gold-Silver Ratio = Gold Price per Ounce ÷ Silver Price per Ounce
For example, if gold trades at $2,000 per ounce and silver trades at $25 per ounce:
$2,000 ÷ $25 = 80
The ratio would therefore be 80:1.
What Is the XAU XAG Ratio?
The xau xag ratio is another way traders refer to the price relationship between gold and silver. XAU is the market symbol commonly used for gold, while XAG represents silver.
When both metals are quoted against the U.S. dollar, traders can calculate the relationship by dividing XAU/USD by XAG/USD.
A rising ratio means gold is outperforming silver on a relative basis. A falling ratio means silver is outperforming gold.
Gold Silver Ratio Chart History and Historical Averages
Looking at gold silver ratio chart history is important because the relationship between gold and silver has changed significantly over time. Different monetary systems, economic cycles, supply conditions, and investor behavior have produced very different ratio levels.
In periods when gold and silver had formal monetary roles, the ratio often traded at much lower levels than those seen in modern freely traded markets. In recent decades, the range has become considerably wider.
One of the most notable modern extremes occurred during the market shock surrounding the COVID-19 pandemic in 2020, when the Gold-Silver Ratio moved above 120:1 as gold strongly outperformed silver.
Historical extremes can provide useful context, but they should not automatically be interpreted as levels that the market must revisit.
What Is the Gold Silver Ratio Average?
There is no single gold silver ratio average that should always be treated as the correct or “normal” value. The average changes depending on the period being measured.
A trader comparing the current ratio with a recent five-year period may reach a very different conclusion from someone studying several decades of market history.
For that reason, historical averages are better treated as reference points rather than fixed price targets.
The more useful question is not simply whether the ratio is above or below an average, but why it is trading at that level in the current market environment.
Why Does the Gold-Silver Ratio Matter to Traders and Investors?
The ratio matters because gold and silver do not always react in the same way to economic conditions.
- Gold is commonly associated with capital preservation and demand for safe haven metals during periods of financial or geopolitical uncertainty.
- Silver also has a precious-metal role, but its price is heavily influenced by industrial activity, including demand from electronics, electrical infrastructure, solar technology, automotive applications, and other manufacturing uses.
- That difference means the two metals can move at different speeds even when both prices are rising or falling.
- A rising Gold-Silver Ratio tells traders that gold is strengthening relative to silver. A falling ratio indicates that silver is strengthening relative to gold.
For gold vs silver investing, this relative view can provide additional context that is not visible when looking at either metal independently.
What Do High and Low Gold-Silver Ratios Mean?
High and low readings can help traders understand which metal is outperforming the other, but they should not automatically be interpreted as trading instructions.
High Gold Silver Ratio Meaning
The high gold silver ratio means that gold is trading at a relatively higher value compared with silver than it was when the ratio was lower.
High readings can appear during periods of economic stress, weaker industrial expectations, or stronger demand for gold as a safe-haven asset.
Because silver has both investment and industrial demand, it may underperform gold when investors become more defensive or when expectations for economic activity weaken.
However, a high Gold-Silver Ratio does not automatically mean silver is undervalued, nor does it guarantee that silver will soon outperform gold.
The ratio can remain elevated for an extended period if the forces supporting gold or weighing on silver continue.
What Does a Low Gold-Silver Ratio Mean?
A low ratio means silver is performing strongly relative to gold.
This can occur when industrial activity strengthens, commodity demand improves, or silver attracts stronger investment flows. It can also happen when both metals rise but silver gains faster than gold.
A low ratio does not prove that gold is undervalued or that the relationship must reverse. It simply describes the relative price relationship between the two metals at that point in time.
Does the Gold-Silver Ratio Predict Future Prices?
The Gold-Silver Ratio can help identify relative trends, but it cannot predict future gold or silver prices with certainty. The ratio is the result of movements in two separate markets. It does not cause either market to move.
For example, a rising ratio could result from gold prices increasing faster than silver, silver prices falling faster than gold, or a combination of both. Several factors can keep the ratio at unusually high or low levels:
- Changes in interest rates and monetary policy
- Inflation expectations
- Geopolitical uncertainty
- Industrial demand for silver
- Investment demand for gold
- Mining supply and recycling
- Broader market risk sentiment
For this reason, the ratio is generally more useful as a supporting indicator than as a standalone forecasting tool.
Gold Silver Ratio Mean Reversion
Gold silver ratio mean reversion is the idea that an unusually high or low ratio may eventually move back toward a previous average or historical range. This concept is commonly used in relative-value analysis, but mean reversion is not guaranteed.
Markets can remain far away from historical averages for extended periods because the economic forces influencing gold and silver can change.
A better analysis therefore asks two questions:
- Is the current ratio historically unusual?
- Are the conditions that created the unusual reading beginning to change?
Without the second question, an extreme ratio alone is not enough to confirm a reversal.
Macro Factors That Influence the Gold-Silver Ratio
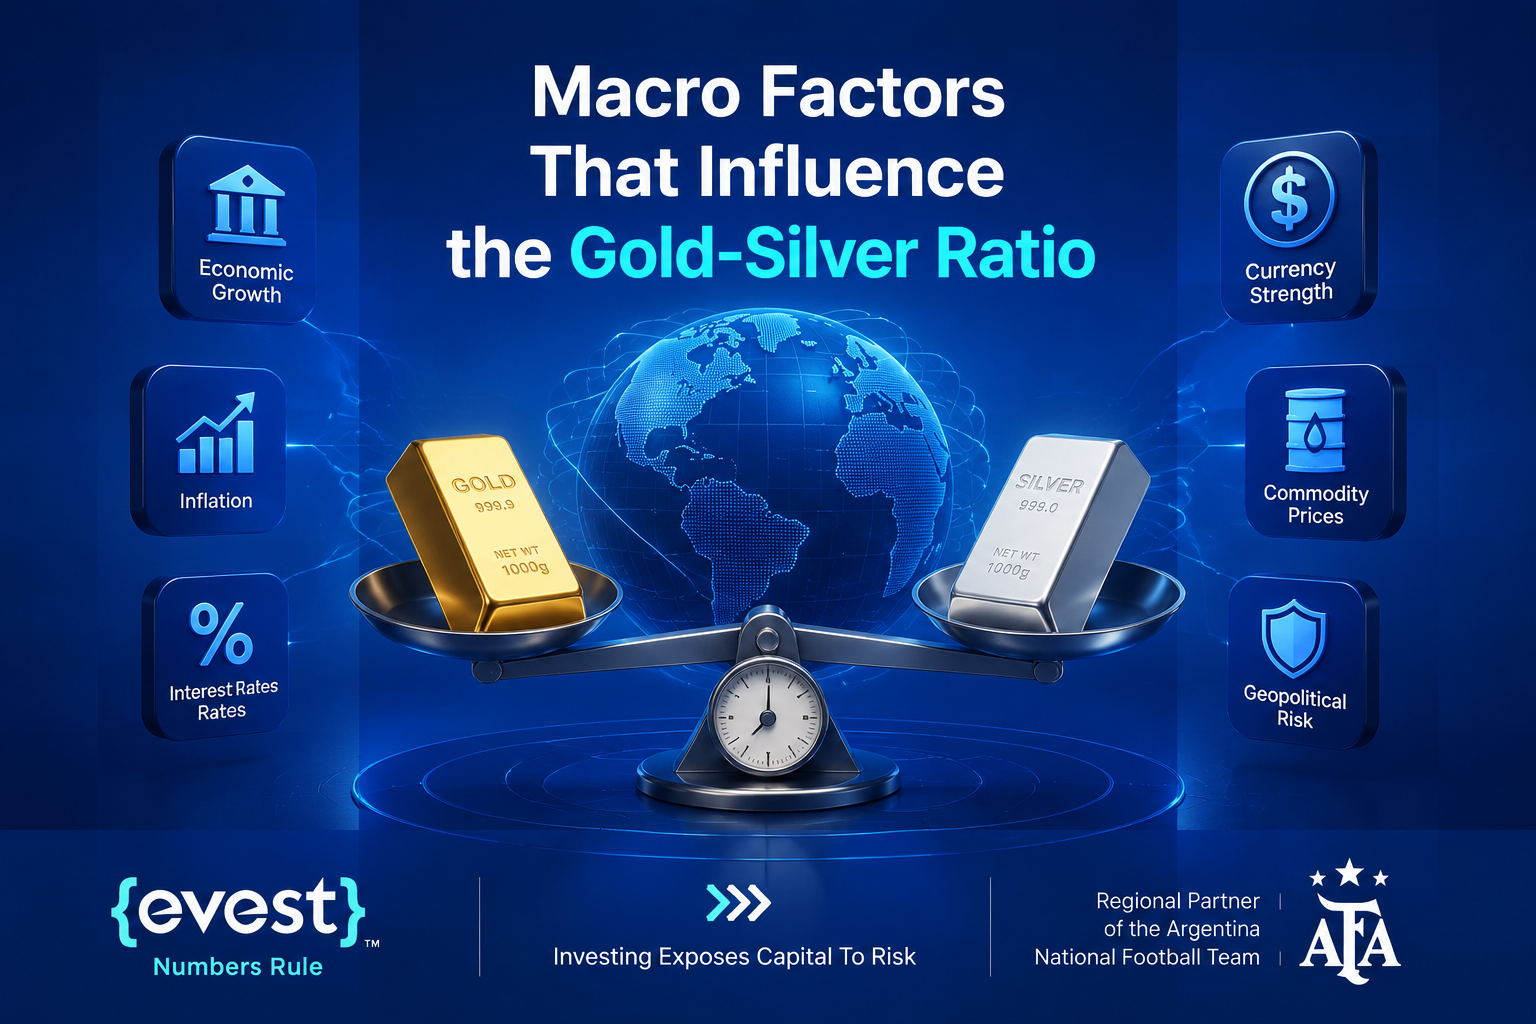
Several macroeconomic and market forces can change the relationship between gold and silver.
Economic Growth and Industrial Silver Demand
Silver combines precious-metal demand with significant industrial use. Stronger manufacturing activity, electrification, solar installations, electronics demand, and other industrial applications can support silver prices.
If silver strengthens faster than gold, the Gold-Silver Ratio falls. During weaker economic conditions, expectations for industrial demand may soften and silver can underperform gold, which may push the ratio higher.
Inflation, Interest Rates, and Safe-Haven Demand
Gold often receives greater attention during periods of monetary uncertainty, inflation concerns, geopolitical stress, or falling confidence in risk assets.
Interest rates also matter because gold and silver do not generate interest income. Changes in real yields, central-bank policy expectations, and the U.S. dollar can therefore influence both metals, although not always to the same degree.
This is one reason the ratio can change even when gold and silver are reacting to the same macroeconomic event.
Gold and Silver Supply and Demand
Gold and silver also have different supply structures. Silver production is often linked to the mining of other metals, while industrial consumption creates demand patterns that differ from those affecting gold.
Changes in mine output, recycling, investment flows, industrial consumption, and available inventories can therefore influence the price relationship between the two metals.
How to Trade the Gold Silver Ratio?
Understanding how to trade the gold silver ratio starts with analyzing the relationship rather than treating a specific ratio level as an automatic signal. A practical process can include the following steps:
- Calculate or monitor the ratio. Divide XAU/USD by XAG/USD.
- Compare the current reading with history. Review recent highs, lows, and longer-term ranges.
- Identify what is driving the movement. Determine whether the change comes mainly from gold, silver, or both.
- Assess the broader market environment. Review interest rates, inflation expectations, industrial demand, risk sentiment, and major economic developments.
- Analyze each metal separately. Check the individual gold and silver price trends before making a decision.
- Define risk before taking a position. Position size, leverage, volatility, and exit levels should be evaluated separately from the ratio.
Using a Precious Metals Ratio Strategy
A precious metals ratio strategy focuses on relative performance. Instead of asking only whether gold or silver will rise, the trader asks which metal may perform better relative to the other.
Some traders monitor historically extreme readings for potential gold silver ratio mean reversion. Others follow the existing trend and focus on whichever metal is showing stronger relative performance.
Neither approach eliminates market risk. A ratio that appears historically extreme can continue moving further in the same direction before reversing—or may establish a new trading range entirely.
Tracking the Gold-Silver Ratio With Evest
Evest provides dedicated market pages and price charts for XAU/USD and XAG/USD, allowing traders to monitor the two underlying prices used to calculate the Gold-Silver Ratio.
A trader following the xau xag ratio can compare gold and silver movements through Evest and calculate the ratio by dividing the XAU/USD price by the XAG/USD price.
The resulting ratio can then be analyzed alongside the individual trend, volatility, and market conditions affecting each metal.
The important point is to use the data as part of a broader analysis rather than treating the ratio alone as a trading decision.
Common Misconceptions and Risks When Using the Gold-Silver Ratio
- One of the biggest mistakes when using the Gold-Silver Ratio is assuming that an extreme reading must immediately reverse.
- There is no fixed level at which the market is required to change direction.
- Numbers such as 80:1 or 50:1 may act as useful historical references in some periods, but they are not universal buy or sell thresholds.
- Another mistake is assuming that a high ratio automatically means silver is cheap or that a low ratio automatically means gold is cheap.
- Relative price does not necessarily equal fundamental undervaluation.
Silver can also experience stronger price swings than gold, causing the ratio to change significantly over relatively short periods. Traders therefore need to distinguish between meaningful changes in the relationship and short-term market volatility.
Leverage and Margin Risk
Trading gold or silver through leveraged products can amplify both potential profits and losses because leverage allows traders to control market exposure greater than the capital committed as margin. The effect of a market movement on an account depends on several factors, including:
- Position size
- Total market exposure
- Leverage
- Account equity
- Margin requirements
- The size of the price movement
It cannot be determined from the leverage ratio alone. For this reason, leverage and margin risk should be assessed independently from the Gold-Silver Ratio signal. A strong relative-value analysis does not make an oversized leveraged position safer.
Gold vs Silver Investing: What Is the Main Difference?
Gold and silver are both precious metals, but their main price drivers are not identical. Gold is more closely associated with wealth preservation, monetary uncertainty, and safe-haven demand.
Silver shares some of those characteristics but also has substantial exposure to industrial demand. As a result, silver may react more strongly to changes in global economic activity and can experience larger price fluctuations, while gold may behave more defensively during periods of uncertainty.
For investors comparing gold vs silver investing, the Gold-Silver Ratio can help show which metal is outperforming the other.
However, investment decisions should also consider individual objectives, risk tolerance, time horizon, volatility, and the underlying fundamentals of each metal.
FAQS
What Is a Good Gold-Silver Ratio?
There is no universally good Gold-Silver Ratio. The current level should be interpreted relative to its historical range and the economic conditions influencing gold and silver. Historical averages and commonly watched levels are reference points rather than automatic investment signals.
Is a High Gold-Silver Ratio Good or Bad?
Neither. A high ratio simply means gold is trading at a higher relative value compared with silver. Whether that creates a potential opportunity depends on why the ratio is high and whether the underlying conditions are changing.
Can the Gold-Silver Ratio Predict Silver Prices?
No. The ratio can show whether silver is strengthening or weakening relative to gold, but it does not independently predict the future direction of silver prices.
How Do You Calculate the XAU XAG Ratio?
Divide the current XAU/USD price by the current XAG/USD price. For example, if gold trades at $2,000 and silver trades at $25: 2,000 ÷ 25 = 80 The resulting Gold-Silver Ratio is 80:1.
How Can Traders Use the Gold-Silver Ratio?
Traders can use the ratio to compare relative performance, study historical extremes, monitor changes in market trends, and support a broader precious metals ratio strategy. It should be combined with analysis of gold and silver individually, macroeconomic conditions, and appropriate risk management.
Can Traders Monitor Gold and Silver Prices on Evest?
Yes. Evest provides dedicated market pages and charts for XAU/USD and XAG/USD, the two prices needed to calculate and monitor the Gold-Silver Ratio.