

The fair value gap trading strategy is a price-action approach that focuses on areas where price moves rapidly and leaves an imbalance across three consecutive candles. In FVG trading, traders identify these zones and monitor how price behaves if it later returns to them. For traders learning technical analysis through Evest, understanding how FVGs form and how they fit within broader price action can provide a more structured way to read market movements rather than relying on a gap alone.
What Is a Fair Value Gap Trading Strategy (FVG) in Trading?
A Fair Value Gap, or FVG, is a price imbalance identified across a three-candle sequence following a strong directional move.
The gap appears when the first and third candles do not fully overlap, leaving a visible range between their relevant wicks. Traders using an imbalance trading strategy monitor these areas because price may later return to them and produce a reaction.
However, the existence of an FVG does not mean that price must revisit the zone or move in a particular direction afterward.
An FVG is therefore better viewed as a potential area of interest within market structure rather than a standalone trading signal.
How to Identify a Fair Value Gap Using the Three-Candle Pattern?
To understand how to identify fair value gap patterns correctly, focus on three consecutive candles and the relationship between the first and third candles.
Bullish FVG
A bullish Fair Value Gap forms when:
- Price makes a strong upward move.
- The low of the third candle remains above the high of the first candle.
- A non-overlapping price range is left between the first candle’s high and the third candle’s low.
For example, assume the first candle has a high of 1.0850. After a strong bullish middle candle, the third candle forms with a low of 1.0870.
The bullish FVG is the zone between 1.0850 and 1.0870.
Bearish FVG
A bearish Fair Value Gap forms when:
- Price moves strongly downward.
- The high of the third candle remains below the low of the first candle.
- The area between the first candle’s low and the third candle’s high becomes the FVG.
The middle candle usually represents the strongest displacement in the three-candle formation.
The colors of the first and third candles are less important than the lack of overlap between their relevant wicks.
Bullish and Bearish Fair Value Gap Setups
Understanding bullish and bearish fair value gap setups helps traders distinguish the direction of the original price movement.
A bullish FVG develops after upward displacement. If price later retraces into the gap, traders may monitor the zone for signs of a bullish reaction.
A bearish FVG develops after downward displacement. If price returns to the gap from below, traders may watch for signs that sellers are becoming active again.
Neither setup guarantees continuation.
Price can react at the edge of an FVG, move deeper into it, completely trade through it, or never return to the gap at all.
That is why a fair value gap trading strategy should consider the surrounding market context instead of treating every detected gap as a trade.
Why Do Fair Value Gaps Form?
- Fair Value Gaps typically appear during strong price displacement, when buying or selling pressure causes price to move rapidly through a range.
- Within FVG and smart-money trading frameworks, traders often interpret this movement as a temporary imbalance in price action.
- What the chart cannot confirm by itself is exactly which market participants caused the move or whether a bank, institution, or particular order was responsible.
- For that reason, an FVG is more accurately treated as evidence of rapid price displacement rather than proof of specific institutional activity.
How FVGs Can Act as Potential Support and Resistance Zones?
After an FVG forms, traders may continue monitoring the zone if price returns to it.
A bullish FVG below the current market price can become a potential reaction area during a retracement. A bearish FVG above the market can similarly become an area where traders watch for a bearish response. The important word is potential.
An FVG does not automatically become support or resistance simply because the pattern exists. Its usefulness depends on factors such as:
- Current trend direction
- Nearby swing highs and lows
- Market structure
- Volatility
- Higher-timeframe context
- Price behavior when the gap is revisited
How to Confirm Fair Value Gaps on Charts?

Correct identification is only the first stage of FVG trading. Traders also need to evaluate whether the gap makes sense within the wider chart.
Check the Market Structure
A bullish FVG that appears during an established upward structure may have a different context from an identical gap forming against the broader trend.
The same applies to bearish setups.
Concepts such as Break of Structure (BOS) and Change of Character (CHoCH) can be used as additional context, but they should not turn an FVG into a guaranteed setup.
Review Multiple Timeframes
An FVG on a short timeframe may appear inside a much larger market structure visible on the 4-hour or daily chart.
Looking at multiple timeframes can help traders distinguish broader areas of interest from smaller intraday movements.
Use Volume as Additional Context
Volume can provide additional information when reliable volume data is available, but a rise in volume should not automatically be described as proof of institutional participation.
Volume data can also differ between instruments and trading venues. Price structure and the quality of the three-candle formation should therefore remain central to FVG analysis.
Fair Value Gap vs. Regular Price Gap
A Fair Value Gap is different from a traditional market gap. A regular gap generally appears when the opening price of one period differs significantly from the previous period’s closing price, leaving a visible empty space between trading sessions or candles.
An FVG occurs within continuous price action and is identified from the relationship between three candles.
This distinction matters because the two patterns represent different chart structures and should not automatically be interpreted in the same way.
Implementing the Fair Value Gap Trading Strategy: Step-by-Step
A structured fair value gap trading strategy can be broken into a few practical stages.
Step 1: Identify the Three-Candle FVG
Confirm that the first and third candles have the required non-overlapping range. Do not label every large candle as an FVG.
Step 2: Determine the Wider Trend
Check whether the gap aligns with or goes against the broader market structure.
Step 3: Wait for Price Behavior Around the Zone
Instead of automatically entering when an FVG appears, traders may wait to see whether price returns to the area and how it reacts.
Step 4: Look for Additional Confirmation
This could include:
- A rejection candle
- A change in short-term structure
- A nearby swing level
- Support or resistance
- Higher-timeframe alignment
Step 5: Define Risk Before Entering
The entry, invalidation level, position size, and potential exit should be considered before executing a position.
Fair Value Gap Entry and Stop Loss: Practical Rules
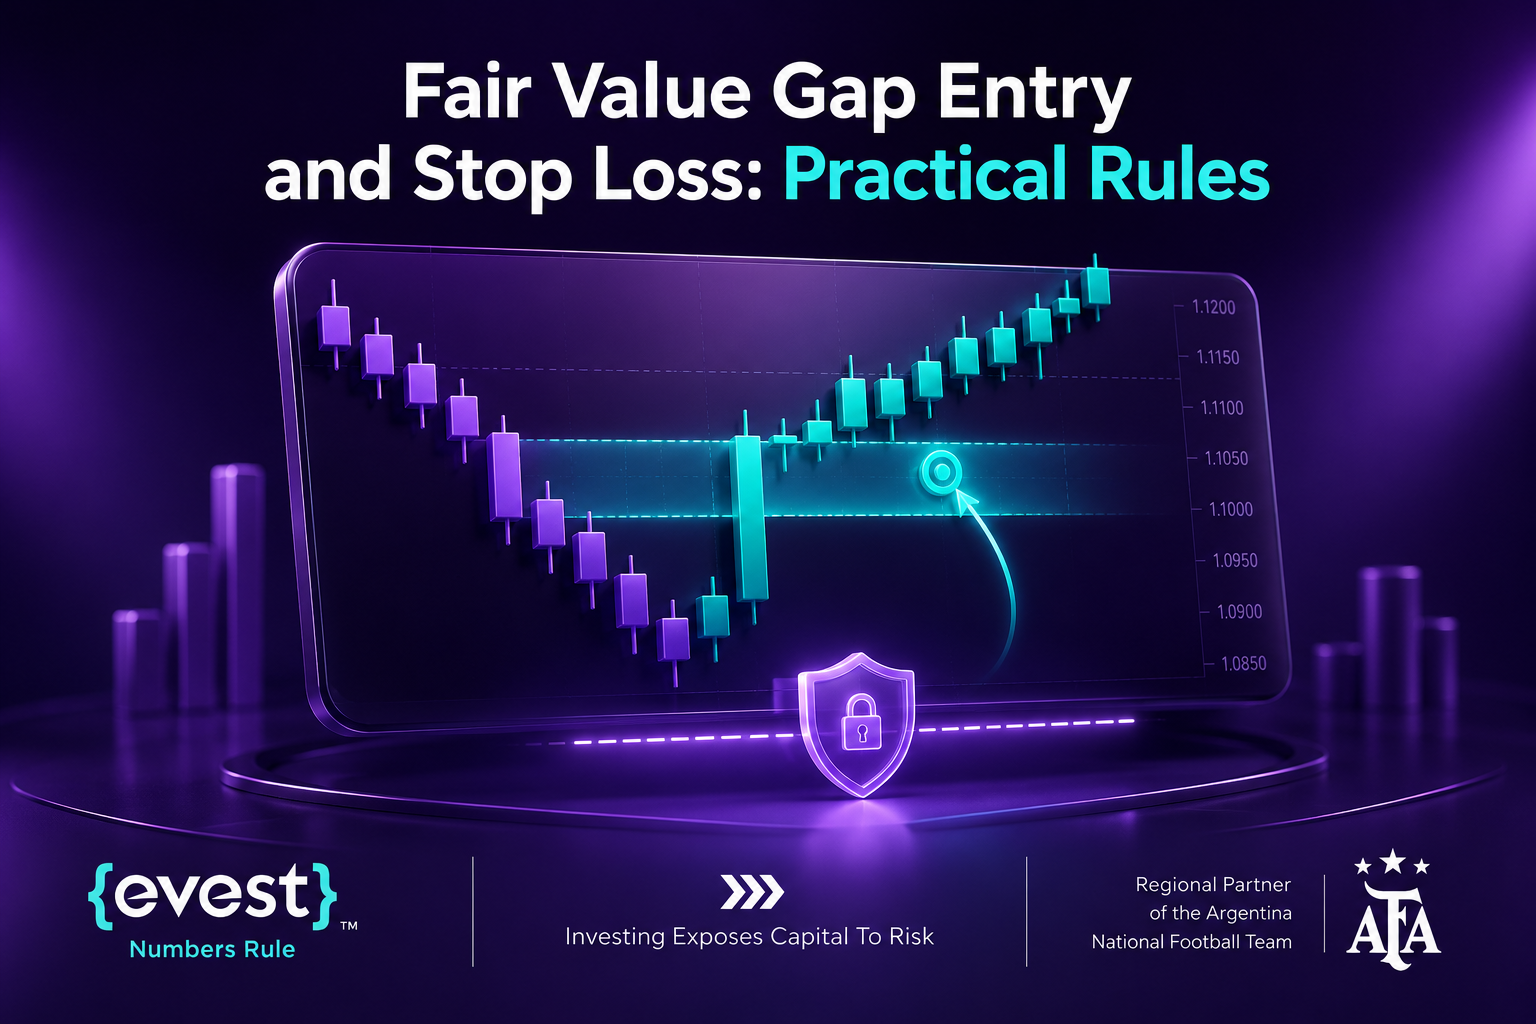
A fair value gap entry and stop loss plan begins only after the FVG has been correctly identified and evaluated within the surrounding market structure.
One common approach is to wait for price to retrace into the gap instead of entering immediately after its formation.
Some traders monitor the midpoint of the gap, while others wait for price-action confirmation inside the zone. There is no universal entry level that works for every FVG.
For a bullish setup, a stop loss may be positioned beyond a relevant structural low or below the point where the setup would be considered invalid.
For a bearish setup, it may be positioned above a relevant structural high or invalidation level.
The appropriate stop distance depends on:
- Market volatility
- Timeframe
- Nearby structure
- Position size
- The trader’s predefined risk rules
A stop loss should therefore be based on the logic of the setup rather than an arbitrary number of pips.
Practical Bullish and Bearish FVG Examples
Practical Fair Value Gap (FVG) examples demonstrate how institutional displacement creates three-candle imbalance zones that traders use for high-probability entries:
Bullish FVG Example
Suppose EUR/USD is moving upward and forms a bullish FVG between 1.0920 and 1.0940.
Price later retraces toward the zone.
Instead of assuming the FVG must hold, a trader may monitor price action inside the area. If bullish confirmation appears while the wider structure remains supportive, the trader can evaluate whether the setup meets their predefined trading and risk rules.
The invalidation point could be based on the relevant market structure below the setup rather than simply placing a stop at a fixed distance.
Bearish FVG Example
Assume a market is trending downward and creates a bearish FVG after a strong decline.
If price retraces upward into the gap, traders may watch for bearish price action and evaluate whether the setup remains consistent with the larger trend.
These examples are hypothetical and intended to explain the process rather than recommend a particular trade.
Advanced Fair Value Gap Trading Techniques
Advanced Fair Value Gap (FVG) techniques move beyond simple gap identification to analyze structural context, confluence, and timeframes to pinpoint high-probability institutional entry zones:
Combining FVGs with Market Structure
Fair Value Gaps can be analyzed alongside market structure concepts such as BOS and CHoCH.
For example, an FVG that develops after a clear structural break can be monitored as part of the new price structure.
This does not make it automatically stronger, but it gives traders additional context for evaluating the setup.
FVGs and Order Blocks
Some trading methodologies combine Fair Value Gaps with Order Blocks or liquidity concepts. The important point is not to stack technical terms simply to create more confirmation.
Each additional concept should have a clear role in the trading plan. If an Order Block, support or resistance level, and FVG all identify a similar area, the overlap may provide a more clearly defined zone to monitor.
What Is the Best Timeframe for FVG Trading?
There is no single best timeframe for FVG setups across every asset or trading style. Higher timeframes such as the 4-hour or daily chart can provide broader market context and may contain less short-term noise than very low timeframes.
Lower timeframes can then be used to examine price behavior or refine potential entries. A practical multi-timeframe process is:
- Identify the larger trend.
- Mark important FVGs and structural levels on a higher timeframe.
- Move to a lower timeframe.
- Wait for price confirmation rather than entering solely because the gap has been reached.
Do You Need a Fair Value Gap Indicator?
A fair value gap indicator can automatically highlight possible FVG zones on a chart.
This can be useful when scanning several instruments or timeframes, but the indicator only identifies patterns based on its programmed conditions. It cannot determine whether every gap is worth trading. Traders still need to evaluate:
- The three-candle formation
- Market trend
- Nearby support and resistance
- Volatility
- Price reaction
- Risk-to-reward considerations
For this reason, a Fair Value Gap indicator can assist analysis but should not replace it.
What Is an Inversion Fair Value Gap?
An inversion fair value gap, also commonly called an inverse fair value gap or IFVG, develops when price breaks through an existing FVG and the original area is later monitored from the opposite direction.
For example, if price breaks below a previously bullish FVG, traders may watch the same zone as a potential resistance area if price later returns.
Similarly, a bearish FVG that is broken upward may later be monitored as potential support.
An IFVG can therefore provide context for a possible shift in market structure, but confirmation from price action remains important.
Risk Management and Common Mistakes in FVG Trading
Even a well-defined fair value gap trading strategy can produce losing trades.
Risk management should therefore be part of the setup from the beginning rather than something considered after entry.
Common mistakes include:
- Trading every FVG that appears
- Assuming every gap must be filled
- Ignoring the wider market trend
- Moving a stop loss because a trade is losing
- Increasing position size after losses
- Treating technical concepts as guarantees
- Using an FVG without a clear invalidation point
Traders using Evest or any other trading environment should understand the risks of the instruments they trade and define how much risk they are prepared to accept before opening a position.
The Importance of Backtesting Your FVG Strategy
Backtesting helps traders evaluate whether clearly defined FVG rules have produced consistent results over a historical sample.
Useful measurements can include:
- Number of tested setups
- Win rate
- Average profit and loss
- Average risk-to-reward ratio
- Maximum drawdown
- Performance by market and timeframe
Historical performance does not guarantee future results, but backtesting can reveal whether a strategy is based on repeatable rules rather than selected chart examples.
FAQs
Is FVG Trading Suitable for Beginners?
FVG trading requires more than recognizing three candles. Traders need to understand trend, market structure, confirmation, invalidation, and risk management. Beginners can study the concept, but it is important to practice identifying setups before relying on them in trading decisions.
Do Fair Value Gaps Get Filled?
Do fair value gaps get filled? Sometimes, but not always. Price may completely retrace through an FVG, partially enter it, react before reaching it, or leave the gap untouched for an extended period. A trading decision should therefore not be based solely on the expectation that every FVG will eventually fill.
How Accurate Are Fair Value Gaps?
There is no universal accuracy rate for Fair Value Gaps. Results depend on the asset, timeframe, market conditions, identification rules, entry criteria, exit rules, and other confirmations used. The most useful way to evaluate an FVG approach is to define objective rules and test them over a meaningful sample
Can FVGs Be Used with Support and Resistance?
Yes. Traditional support and resistance identify areas where price has previously reacted, while an FVG identifies a specific three-candle imbalance. When the two occur near the same price area, traders can use the broader support or resistance level as additional context rather than assuming either tool predicts the next market move.