

The CCI indicator, also known as the Commodity Channel Index, is a momentum oscillator that compares an asset’s current price with its recent average. Traders use it to evaluate whether momentum is strengthening or weakening, identify unusually strong price movements, monitor changes around the zero line, and detect divergence between price and momentum. Despite its name, the CCI indicator is not limited to commodities and can be applied to forex, stocks, indices, metals, energy markets, and cryptocurrencies. This guide explains its formula, settings, trading signals, divergence, practical uses, limitations, and risk-management considerations across different trading styles and market conditions today. A CCI trading strategy uses these readings as context rather than as automatic instructions.
What Is the Commodity Channel Index (CCI)?
The Commodity Channel Index is an unbounded oscillator developed by Donald Lambert in 1980. It was originally designed to identify cyclical movements in commodity prices, but traders later began applying it across a wider range of financial markets. The core concept is simple. When the current typical price is above its recent average, the oscillator produces a positive reading.
When the current typical price is below its recent average, it produces a negative reading. The farther price moves from that average, the more extreme the reading becomes. CCI normally appears in a separate window beneath the price chart. The zero line is its central reference, while +100 and -100 are commonly used to identify strong positive or negative deviations.
Some traders also monitor +200 and -200 when looking for more extreme momentum conditions. The oscillator is described as unbounded because it has no fixed maximum or minimum. It can move above +100 or below -100 for several periods, particularly during strong trends. For that reason, an extreme reading should not be treated as proof that a reversal is about to happen. A CCI trading strategy should treat extreme readings as context rather than proof of reversal.
How to Use CCI Indicator in Technical Analysis?
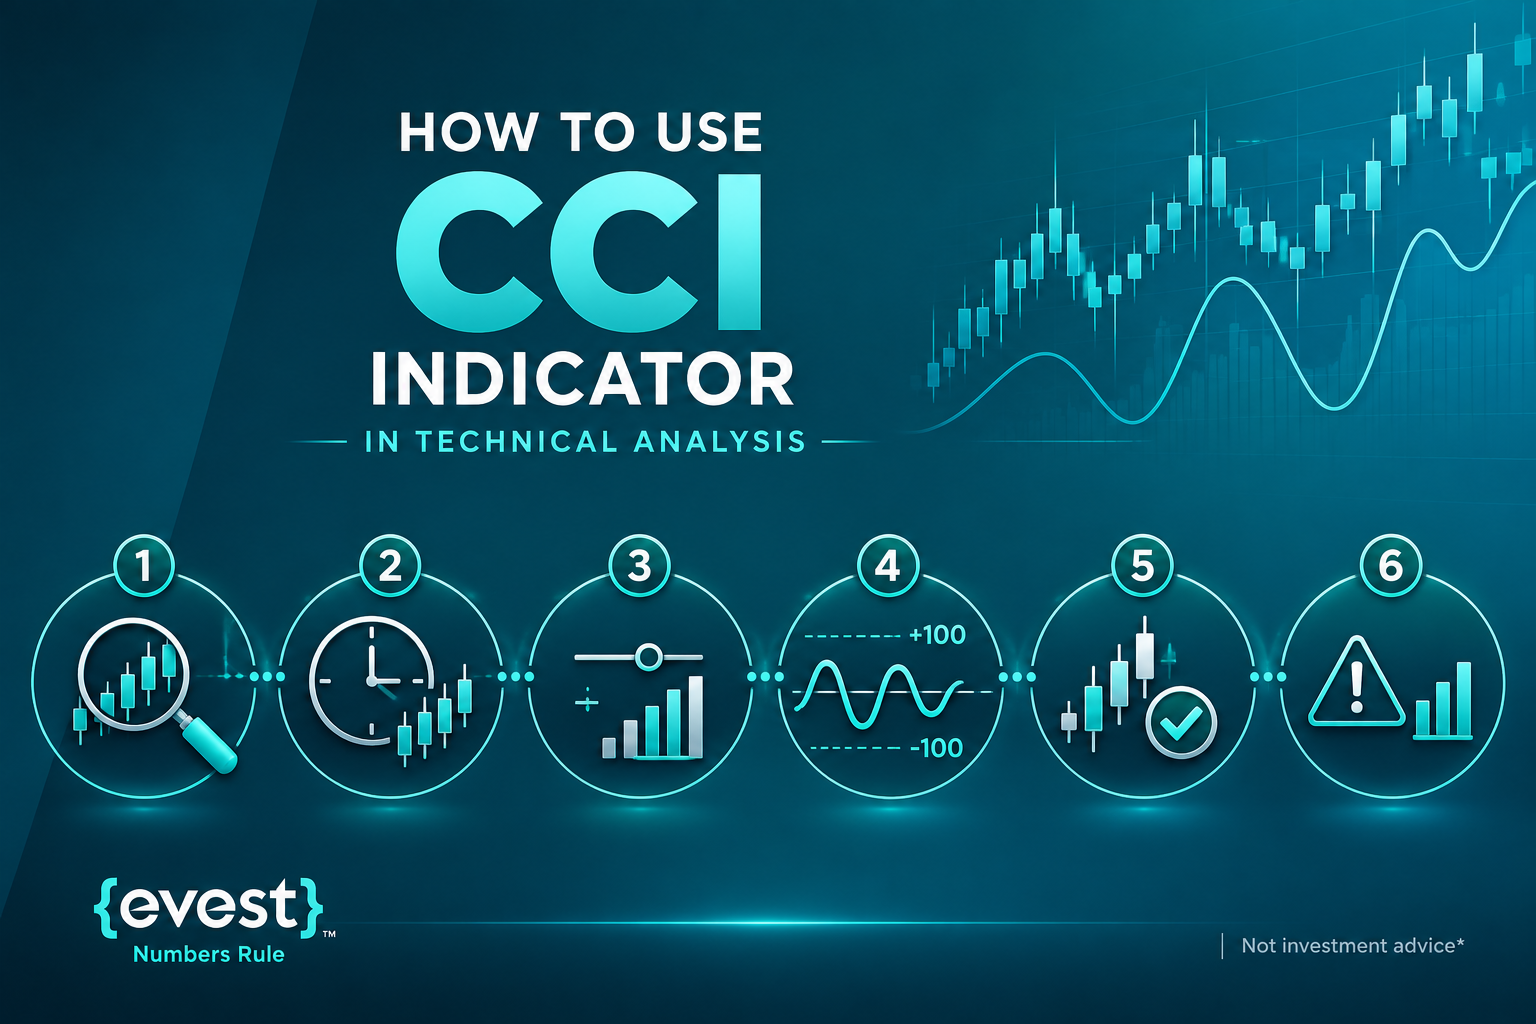
Traders researching how to use CCI indicator signals should follow a repeatable process rather than reacting to every movement above or below a reference level. A CCI trading strategy becomes easier to evaluate when the same analytical sequence is followed consistently.
1. Define the Market Condition
Start by deciding whether price is trending, ranging, or moving without a clear structure. Higher highs and higher lows may indicate an uptrend. Lower highs and lower lows may indicate a downtrend. Repeated movement between support and resistance may indicate a range.
2. Select a Suitable Timeframe
The timeframe should match the purpose of the analysis. A day trader may use intraday charts, while a swing trader may focus on four-hour or daily charts. Very short timeframes create more signals but also produce more noise and false movements. The timeframe should also match the expected holding period. A signal on a five-minute chart may have little relevance to a position intended to remain open for several days.
3. Apply a Starting Period
A 20-period setting provides a practical starting point. It offers a balance between speed and stability. A shorter setting may react earlier but produce more false movements. A longer setting may filter some noise but respond later when momentum changes. The starting period should be treated as a testing point rather than a fixed recommendation.
4. Identify the Signal Type
Determine whether the oscillator is showing:
- A zero-line cross.
- A move above +100 or below -100.
- A return from an extreme area.
- Bullish or bearish divergence.
- Sustained momentum on one side of zero.
Each signal represents a different market condition. A zero-line cross measures the relationship between price and its recent average, while divergence compares price direction with momentum direction.
5. Confirm the Signal With Price
Check whether the price chart supports the reading. Useful confirmation may come from market structure, support and resistance, candlestick behaviour, volume, or volatility. The oscillator should support the analysis, not replace it. For example, a bullish momentum reading near a confirmed support area may have more context than the same reading in the middle of an undefined range.
6. Define Risk Before Considering an Entry
Identify the invalidation level, expected loss, position size, and potential target before opening a position. A technically valid signal can still result in a losing trade. Risk should therefore be defined before the market moves against the position, not after the loss begins to increase.
Understanding CCI Trading Signals
The main CCI trading signals fall into four categories: zero-line crosses, extreme readings, returns from extreme zones, and divergence. Each signal describes momentum from a different angle. Within a CCI trading strategy, these signals should be interpreted according to the surrounding price structure.
Zero-Line Crosses
A cross above zero means the typical price has moved above its recent average. A cross below zero means it has moved below its recent average. Some traders use zero-line crosses as a momentum filter. In a bullish market structure, they may focus on setups that occur while the oscillator is above zero. In a bearish structure, they may focus on readings below zero.
The weakness of this method is that the oscillator can cross zero repeatedly in a sideways market. Waiting for price confirmation or for the reading to remain on one side of zero for more than one candle may reduce false signals, but it cannot eliminate them.
A zero-line cross should also be evaluated in relation to recent price structure. A cross above zero during a clear downtrend may represent only a temporary recovery rather than the beginning of a sustained upward move.
CCI Overbought and Oversold Levels
CCI overbought/oversold analysis usually focuses on +100 and -100. A reading above +100 means price has moved significantly above its recent average. A reading below -100 means it has moved significantly below its recent average.
These conditions are commonly called overbought and oversold, but those labels should not be interpreted as automatic reversal instructions. A market can remain above +100 during a strong upward move or below -100 during a strong downward move. One method is to wait for the oscillator to return inside the +100 to -100 range. A move back below +100 may indicate that positive momentum is weakening.
A move back above -100 may indicate that negative momentum is weakening. Price confirmation is still required. Readings above +200 or below -200 show more extreme deviation. They may attract attention, but they can also appear during powerful trends. The more extreme the reading, the more important it becomes to distinguish possible exhaustion from trend continuation. Support, resistance, market structure, and volatility can help provide this context.
Bullish and Bearish Divergence
Divergence appears when price and the oscillator move in different directions. It may indicate that the momentum supporting the current trend is weakening. Bullish divergence occurs when price forms a lower low while the oscillator forms a higher low.
Price has continued falling, but negative momentum has weakened. Bearish divergence occurs when price forms a higher high while the oscillator forms a lower high.
Price has continued rising, but positive momentum has weakened. Divergence is an early warning rather than a timing tool.
CCI Divergence Strategy
A CCI divergence strategy should combine momentum information with a clear price trigger. A CCI trading strategy based on divergence also needs confirmation, location, and a defined invalidation point. First, identify a meaningful swing high or swing low on the price chart.
Minor fluctuations in the middle of a noisy range are less useful than clear structural points. Second, compare the two price swings with the corresponding oscillator swings. A lower price low with a higher oscillator low creates bullish divergence.
A higher price high with a lower oscillator high creates bearish divergence. Third, evaluate the location of the pattern. Bullish divergence near established support is generally more relevant than bullish divergence in the middle of an undefined range. Bearish divergence near resistance may deserve more attention than the same pattern without structural context. Fourth, wait for confirmation.
Examples include:
- A change in swing structure.
- A rejection candle.
- A break of a short-term trend line.
- A return through a relevant momentum level.
- A failed attempt to continue the existing trend.
Finally, define the invalidation point. If price continues through the structural low or high that supported the setup, the divergence idea may no longer be valid. This process does not guarantee a reversal. Its purpose is to prevent every visual difference between price and momentum from being treated as a complete strategy.
A divergence setup should also be evaluated in relation to potential risk and reward. A technically valid pattern may not be suitable when the invalidation point is too far from the proposed entry or when the nearest target offers limited potential.
CCI Indicator Settings
There is no single set of CCI indicator settings that works best across every instrument, timeframe, and market condition. The selected period controls how quickly the oscillator reacts. A shorter period uses fewer candles. It responds more quickly to recent price changes and creates more frequent signals. The disadvantage is greater sensitivity to market noise. A longer period uses more candles. It produces smoother readings and fewer signals.
The disadvantage is a slower response when momentum changes. These ranges are testing points, not fixed recommendations. The correct setting should be evaluated on the selected market, timeframe, and trading session. A configuration that behaves well on one instrument may behave differently on another. The selected setting should also match the strategy.
A trend-continuation strategy may require different sensitivity from a strategy designed to identify possible reversals. Changing the period without defining the purpose of the strategy makes the results difficult to evaluate. A CCI trading strategy should therefore test settings according to its exact purpose.
| Trading approach | Possible testing range | Typical effect |
| Short-term or scalping analysis | 9–14 periods | Faster response and more noise |
| Intraday analysis | 14–20 periods | Balance between speed and stability |
| Swing trading analysis | 20–30 periods | Smoother signals and fewer reversals |
| Longer-term analysis | 30–50 periods | Slower response and broader context |
Best CCI Settings for Day Trading
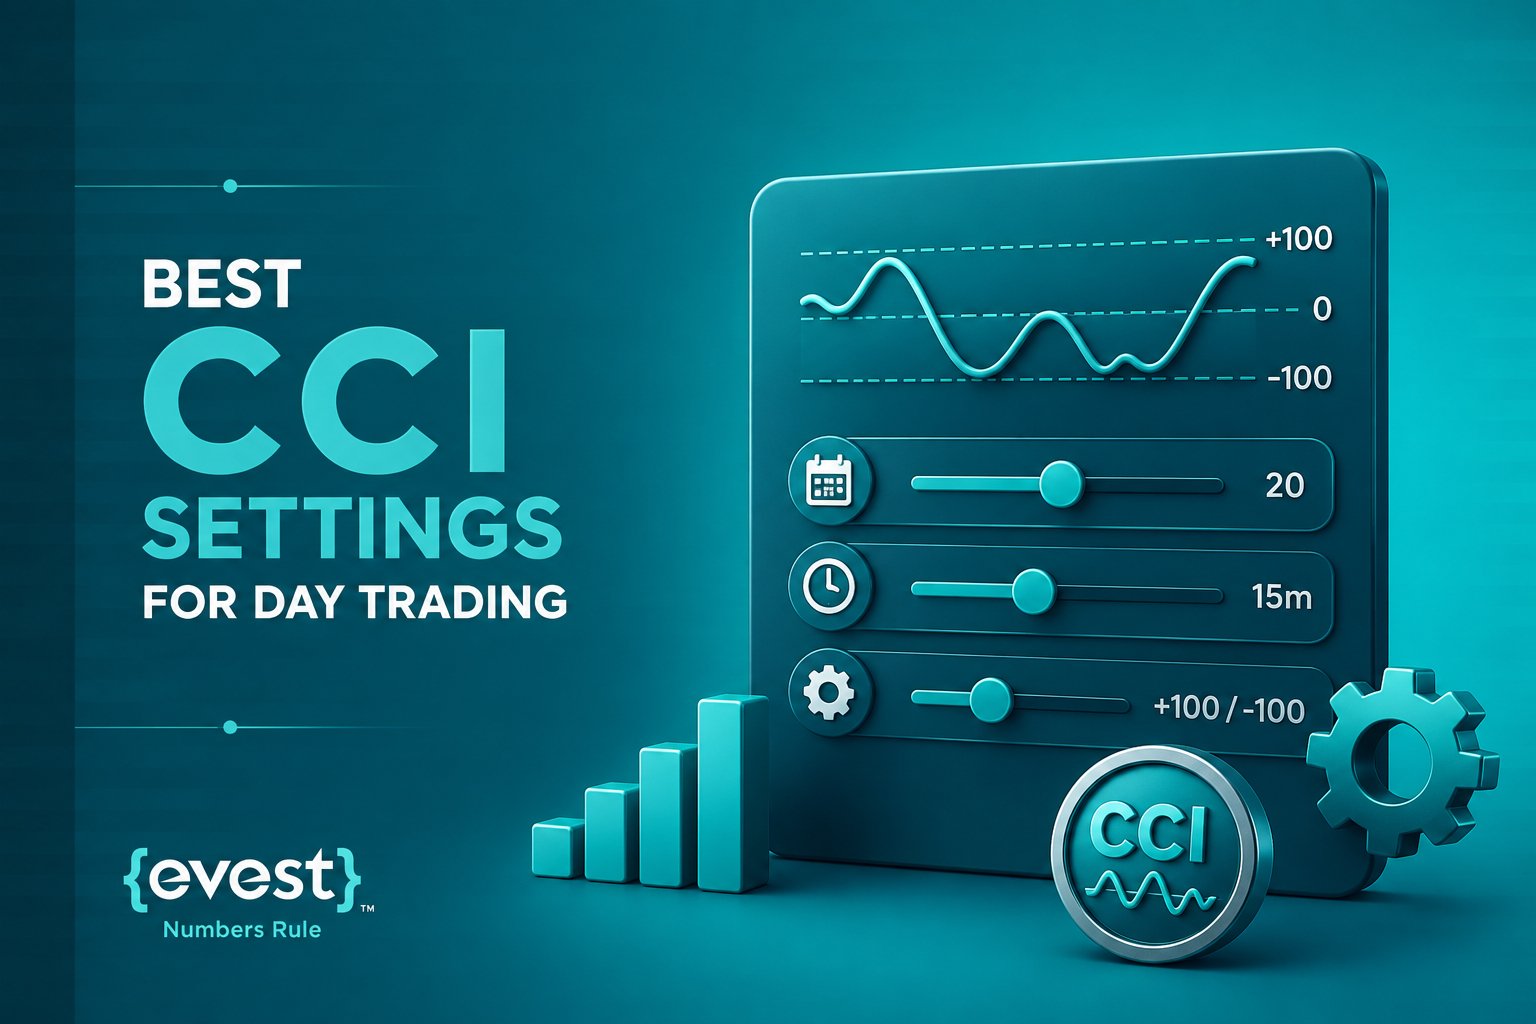
Traders looking for the best CCI settings for day trading often test 9, 14, and 20 periods on intraday charts. There is no universal winner. A 9-period setting may identify momentum changes earlier, but it can produce frequent false crosses. A 14-period setting may provide a middle ground between speed and stability. A 20-period setting is slower but may reduce some market noise.
Testing should measure more than the number of winning trades. It should also consider:
- Maximum drawdown.
- Average gain.
- Average loss.
- Signal frequency.
- Spread and transaction costs.
- Performance in trending markets.
- Performance in ranging markets.
- Performance during different trading sessions.
A setting should not be selected because it worked on one chart example. It should be evaluated over a meaningful historical sample and, where possible, tested on data that was not used to create the strategy. A setting that produces fewer signals may still be more useful if those signals are clearer and easier to manage.
How to Reduce False Signals?
False signals cannot be eliminated, but a structured filtering process can reduce avoidable decisions. Start with price structure. Identify the broader trend, range boundaries, and important levels before reading the oscillator. Do not act on a reading above +100 or below -100 by itself. It describes momentum and deviation, not a complete trade.
Look for independent confirmation, such as:
- A momentum shift near support or resistance.
- A break in swing structure.
- A confirming candle.
- A failed breakout.
- A change in volatility.
- Agreement with the broader trend.
Consider volatility because sudden expansion can push readings to extreme levels without causing an immediate reversal. Avoid using several similar oscillators together. Multiple tools that measure the same behaviour may create the illusion of confirmation.
Finally, define the setup, confirmation, invalidation, exit, and risk rules before testing historical performance. A strategy cannot be evaluated properly when its rules change from one trade to another. The review process should also include losing setups. Studying only successful examples can create unrealistic expectations about how clearly signals appear in live market conditions.
Using CCI in an Evest Trading Workflow
For an Evest reader, the practical objective is to turn the analysis into a repeatable process. Open the instrument and timeframe that match your trading plan through the platform available in your Evest account. Add the Commodity Channel Index from the technical indicator menu and begin with a standard period such as 20.
Before reading the oscillator, mark:
- The current market trend.
- Important support and resistance areas.
- Recent swing highs and swing lows.
- The current volatility environment.
- Any upcoming event that may affect the instrument.
Then check the oscillator’s position relative to zero, +100, and -100, and compare its direction with price.
When a setup appears, record:
- The current market structure.
- The relevant support or resistance level.
- The momentum signal.
- The price confirmation.
- The invalidation point.
- The planned risk.
- The potential target.
This is more useful than writing only that “CCI gave a buy or sell signal.” It separates the reading from the complete trading decision and makes the process easier to review later. A trading journal can also help identify whether certain settings perform differently across timeframes or market conditions.
Evest educational content should be treated as a framework for analysis, not as personal investment advice or an instruction to open a position. Market conditions can change quickly, and historical behaviour does not guarantee future results.
FAQs
What Are the Main CCI Trading Signals?
CCI trading signals include zero-line crosses, moves above +100 or below -100, returns from extreme areas, and bullish or bearish divergence. These signals describe clear momentum changes, but traders should confirm them with price structure, market context, and risk rules.
What Is the Standard CCI Period?
A 20-period setting is a starting point for the CCI indicator. Shorter periods react faster and generate more signals, while longer periods respond more slowly and create smoother readings. The selected period should match the market, timeframe, and overall strategy.
Can CCI Remain Overbought or Oversold?
Yes. During a strong trend, the CCI indicator can remain above +100 or below -100 for an extended period. An extreme reading should not be treated as an automatic reversal signal without price confirmation, market structure, and broader trend context.
Does Divergence Always Lead to a Reversal?
No. Divergence shows that price and momentum are no longer moving in the same direction, but the existing trend may continue. Traders should wait for price confirmation, such as a structure break, rejection, or reversal pattern, before considering a position.
Can CCI Guarantee Profitable Trades?
No technical indicator can guarantee profitable trades. Results depend on market conditions, execution quality, trading costs, position sizing, risk management, and how each signal is interpreted. The CCI indicator should support a broader trading process rather than replace disciplined analysis.