
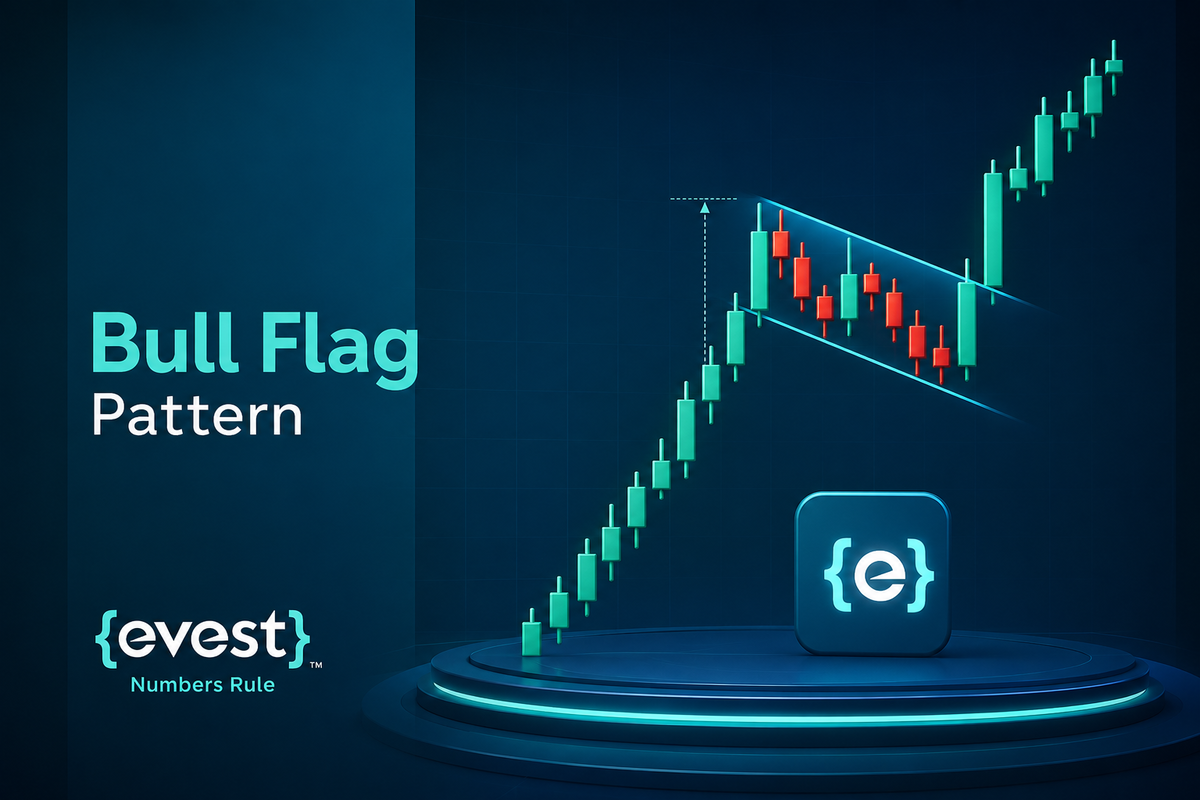
The Bull Flag Pattern is a commonly used bullish continuation pattern in technical analysis. It may help traders identify potential continuation setups within an existing uptrend, especially when the setup is supported by price structure, volume, and broader market context.
This chart pattern usually appears after a sharp upward move, followed by a short consolidation phase before the price may continue higher. However, like all technical patterns, it does not guarantee future price movement. Traders should treat it as a probability-based setup, not a certainty.
This guide explains what the Bull Flag Pattern is, how to identify it on charts, how traders approach entries and exits, and how to manage risk when trading potential breakouts.
What Is a Bull Flag Pattern and Why Do Traders Watch It?
A Bull Flag is a bullish continuation pattern that forms after a strong price rally. The rally creates the flagpole, while the smaller sideways or downward-sloping consolidation creates the flag.
The formation represents a temporary pause within an existing uptrend rather than an automatic reversal. If price later closes above the flag’s upper boundary with sufficient momentum, traders may interpret the move as a possible continuation of the previous trend.
In simple terms, the Bull Flag shows a strong upward move followed by a short pause or pullback. If the price later breaks above the flag resistance with confirmation, traders may view it as a potential continuation signal. The important word here is potential. A Bull Flag is not a guarantee that price will continue higher.
The Market Psychology Behind Bull Flag Formation
The Bull Flag Pattern is often interpreted as a pause in buying momentum rather than a full trend reversal.
The initial rally, or flagpole, reflects strong demand. After that move, some traders may take profits, causing the price to consolidate. If selling pressure remains limited and buyers return, the price may break above the flag and continue the prior uptrend.
This interpretation is probabilistic and should not be treated as certainty. Market conditions can change quickly, especially around major news events, earnings releases, or high-volatility sessions.
Key Characteristics of a Valid Bull Flag Pattern
A higher-quality Bull Flag setup commonly includes:
- A clear and impulsive upward move that forms the flagpole.
- A shorter consolidation that moves sideways or slightly downward.
- A pullback that does not erase most of the initial rally.
- Lower volatility during the consolidation phase.
- A breakout above the flag’s resistance in the direction of the previous trend.
- Supporting volume or momentum during the breakout.
- Sufficient space before the next major resistance level.
Market context remains essential. A Bull Flag that forms within an established uptrend is generally more relevant than a similar shape appearing in a sideways or highly unstable market.
How to Identify a Bull Flag Pattern on Charts?
To identify a Bull Flag Pattern, start by looking for an existing uptrend and a sharp upward move. Then observe whether the price forms a controlled consolidation that does not fully reverse the prior move.
A practical process is to find a strong flagpole, check whether the consolidation is shallow and organized, review volume or momentum, and wait for breakout confirmation. The setup can be useful, but the shape alone is not enough. Traders still need to evaluate market context, risk-reward, and invalidation levels before entering.
Recognizing the Strong Uptrend Flagpole
The first step is identifying the flagpole. This is usually a sharp upward movement that shows strong buying pressure.
The following example is hypothetical and for illustration only: if EUR/USD rallies from 1.0800 to 1.0950 within a short period, that move may form a potential flagpole. However, the setup is not complete unless price later forms a controlled consolidation and then confirms a breakout.
A strong flagpole should stand out clearly on the chart. It usually shows momentum, price expansion, and limited overlap between candles. Without that initial strength, the pattern may simply be ordinary sideways movement rather than a true Bull Flag setup.
Identifying the Consolidation Phase Flag
After the flagpole, the price may move sideways or slightly downward. This creates the flag.
The flag should usually be shorter and calmer than the flagpole. A very deep pullback may suggest that the trend is weakening rather than pausing.
Many traders prefer shallow retracements, often below 50%, but this is a guideline, not a fixed rule. A retracement that is too deep, such as one that erases most of the flagpole, may reduce the quality of the setup.
The flag may take different forms:
- A small downward channel.
- A rectangular range.
- A slightly sideways consolidation.
- A tight pullback with lower volatility.
Volume Analysis Confirming the Pattern
Volume can provide useful context when assessing a Bull Flag, particularly in stocks and exchange-traded instruments.
A commonly observed sequence is:
- Higher volume during the initial rally.
- Lower volume while price consolidates.
- Renewed volume as price breaks above the flag.
This sequence can indicate strong participation during the flagpole, limited selling pressure during the pullback, and renewed demand during the breakout.
Volume should not be treated as a standalone signal. Traders should also review the breakout candle, market trend, nearby resistance levels, and the point at which the pattern would become invalid.
In decentralized markets such as spot forex, centralized volume data may not be available. Tick volume, candle structure, momentum, and price behavior around the breakout level can be used as supporting information.
Timeframe Considerations for Bull Flags
Bull Flag Patterns can form on many timeframes, including:
- 5-minute charts.
- 15-minute charts.
- 1-hour charts.
- 4-hour charts.
- Daily charts.
- Weekly charts.
Longer timeframes may filter out some market noise and may provide cleaner setups. Shorter timeframes may offer more frequent setups, but they are more vulnerable to noise, spread, slippage, and false breakouts.
Multi-timeframe analysis can help. For example, a Bull Flag on a 4-hour chart may be more meaningful if the daily chart also shows an uptrend.
Effective Strategies for Trading the Bull Flag Pattern
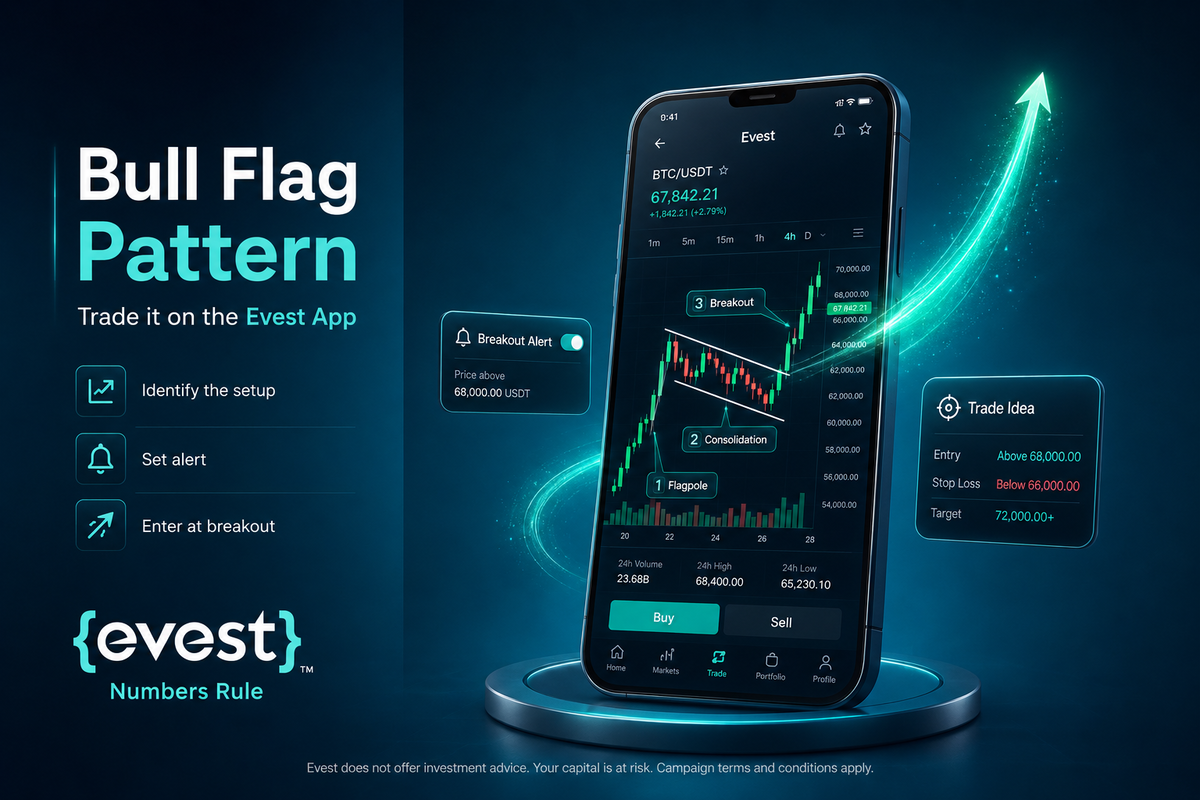
Trading a Bull Flag Pattern usually involves waiting for breakout confirmation, defining risk, and calculating position size before entering.
A basic trading approach may include:
- Identifying the flagpole.
- Waiting for flag consolidation.
- Watching for a confirmed breakout.
- Setting a Stop Loss below the flag or recent swing low.
- Estimating a potential Take Profit target.
- Calculating position size based on risk.
Position size should be calculated based on account size, stop-loss distance, and risk percentage. Traders should avoid choosing lot size randomly or based only on confidence in the setup.
Entry Points Without Colon Breakout Confirmation and Retests
The most common entry approach is to wait for a breakout above the upper boundary of the flag.
A stronger breakout may include:
- A candle close above the flag resistance.
- Increased volume or momentum.
- A breakout in the direction of the broader trend.
- A favorable risk-reward ratio.
Some traders prefer to wait for a retest of the breakout level. In this case, the former resistance may act as support.
Avoid chasing the breakout after a large move, as the risk-reward ratio may become weak. Entering too late can mean that the Stop Loss is far away while the potential target is limited.
Setting Stop Loss Orders for Risk Management
Stop Loss placement is an important part of trading Bull Flag setups.
Common Stop Loss locations include:
- Below the lower boundary of the flag.
- Below the most recent swing low.
- Below a nearby support level.
- At a level that invalidates the pattern.
Stop Loss orders reduce risk but may not execute at the exact price during gaps or high volatility. This is especially important around major news events or low-liquidity periods.
The goal is not to avoid every loss. The goal is to keep losses controlled when the setup fails.
Determining Take Profit Targets Using Flagpole Measurement
Consider a hypothetical market that rises from 100 to 110, creating a 10-point flagpole. Price then consolidates between 107 and 109 before closing above the flag’s resistance at 109.
A trader evaluating the setup might consider:
- Possible entry: After a confirmed close above 109 or after a successful retest of the breakout level.
- Possible invalidation level: Below the lower boundary of the flag or the most recent swing low.
- Projected target: Adding the 10-point flagpole measurement to the breakout area, producing a theoretical target near 119.
- Additional consideration: Reviewing nearby resistance before relying on the full projected target.
This example is for educational purposes only. The projected target is not guaranteed, and price may reverse before reaching it. Position size should be determined using the entry price, stop-loss distance, account size, and predefined risk limit.
Combining Bull Flags with Other Technical Indicators
Technical indicators can provide additional context, but they should not replace the pattern’s price structure.
The most useful supporting tools may include:
- Volume: To assess participation during the flagpole, consolidation, and breakout.
- Moving averages: To review the direction of the broader trend and possible dynamic support.
- ATR: To understand current volatility and avoid placing a stop loss inside normal price movement.
- Support and resistance: To identify nearby barriers and logical invalidation levels.
A Bull Flag should not be considered valid simply because several indicators produce bullish readings. Price structure, breakout quality, market context, and risk remain more important than the number of indicators used.
Common Mistakes to Avoid When Trading Bull Flag Patterns
Before using advanced tools, traders should understand the most common mistakes.
These include:
- Entering before breakout confirmation.
- Ignoring volume.
- Chasing price after a large breakout candle.
- Placing Stop Loss too close.
- Using excessive leverage.
- Ignoring market context.
- Treating the pattern as a guaranteed signal.
- Trading directly into major resistance.
A Bull Flag is a setup, not a certainty. The quality of the trade depends on execution, confirmation, and risk management.
Ignoring Volume Confirmation
Ignoring volume is one of the most common mistakes when trading Bull Flag setups.
A breakout with weak volume may fail quickly, especially in stocks. If price moves above the flag but lacks participation, it may fall back into the consolidation area.
In decentralized markets like spot forex, volume data may be limited or represented as tick volume. In this case, traders may also rely on momentum, candle structure, and price behavior around the breakout level.
Entering Too Early or Too Late
Entering before confirmation exposes the trader to unnecessary risk. The price may continue consolidating, break down, or invalidate the setup.
Entering too late can also be a problem. If the breakout already moved too far, the Stop Loss may become wide and the reward-to-risk ratio may become unattractive.
A disciplined trader waits for confirmation, then checks whether the trade still offers a reasonable setup.
Improper Stop Loss Placement
A Stop Loss that is too tight may be triggered by normal market fluctuation. A Stop Loss that is too wide may expose the account to unnecessary loss.
The Stop Loss should be placed where the pattern would be considered invalid, not at a random distance.
For example, if the flag support is clearly defined, a Stop Loss below that structure may be more logical than placing it too close to the entry price.
Over-Leveraging on Bull Flag Trades
High leverage can turn a small false breakout into a large account loss. Even if the pattern looks strong, leverage should be used carefully. A valid-looking Bull Flag can still fail because of news, low volume, strong resistance, or a sudden shift in market sentiment. Traders should define risk before entry and avoid risking more than they can afford to lose.

Advanced Bull Flag Trading Techniques and Considerations
Advanced traders may use additional tools to refine entries, targets, and trade management.
These may include:
- Fibonacci extensions.
- Multi-timeframe analysis.
- ATR-based Stop Loss placement.
- Liquidity analysis.
- Market sentiment.
- Correlation with related assets.
- News-event awareness.
These tools can support decision-making, but they do not remove trading risk.
Trading Bull Flags with Fibonacci Extensions
Fibonacci extensions are sometimes used to project potential price targets after a breakout.
Common extension levels include:
- 127.2%.
- 161.8%.
- 200%.
Fibonacci extensions are projection tools, not guaranteed price targets. Price may fail before reaching any extension level.
They are best used alongside support and resistance, prior highs, volume, and market context.
The Role of Liquidity and Volatility in Bull Flag Breakouts
Liquidity and volatility can strongly affect breakout quality.
High liquidity may help reduce slippage and improve execution. Low liquidity can increase slippage and make breakout entries less reliable.
High volatility may create fast breakouts, but it can also produce false moves and wider stop-loss requirements.
Before trading a breakout, traders should consider:
- Spread.
- Slippage.
- Market session.
- News events.
- Asset liquidity.
- Volatility level.
Managing Failed Bull Flag Patterns and False Breakouts
Not every Bull Flag succeeds. Failed patterns and false breakouts are part of trading.
Warning signs of a failed Bull Flag may include:
- Breakout without volume.
- Price closing back inside the flag.
- Breakout directly into major resistance.
- Weak momentum after the breakout.
- Sudden negative news.
- Deep retracement during the flag.
If price closes back inside the flag after the breakout, traders often reassess or exit based on their plan.
A predefined plan is important because emotional decisions after a failed breakout may increase losses.
Bull Flag Pattern vs. Other Continuation Patterns
The Bull Flag is one of several continuation patterns. It is often compared with the Bull Pennant, Ascending Triangle, and Bear Flag.
| Pattern | Direction | Structure | Typical Meaning |
| Bull Flag | Bullish | Rectangular or slightly downward consolidation after a sharp rally | Potential continuation of an uptrend |
| Bull Pennant | Bullish | Small symmetrical triangle after a sharp rally | Potential continuation after compression |
| Ascending Triangle | Often bullish | Flat resistance with rising support | Buyers may be gaining pressure |
| Bear Flag | Bearish | Rectangular or slightly upward consolidation after a sharp decline | Potential continuation of a downtrend |
Factors Influencing Bull Flag Reliability
A Bull Flag may be more reliable when:
- The flagpole is strong and impulsive.
- The consolidation is shallow.
- Volume declines during the flag.
- Volume increases during breakout.
- The broader trend is bullish.
- The breakout is not directly below major resistance.
- The risk-reward ratio is reasonable.
A Bull Flag may be weaker when:
- The flag retraces too deeply.
- The consolidation lasts too long.
- Volume increases during the pullback.
- The breakout lacks momentum.
- The broader market is weak.
- Major news is about to be released.
Practical Application of Bull Flag Patterns in Saudi Arabia and the UAE
The Bull Flag Pattern can be applied to different asset classes, including stocks, indices, commodities, and forex pairs. However, application depends on the asset, broker, exchange, and applicable regulation.
Traders in Saudi Arabia and the UAE should verify the licensed entity before trading. Regulatory oversight depends on the legal entity, product type, and jurisdiction. Do not assume one license covers all products.
The pattern may appear on:
- Regional stocks.
- Local indices.
- Global stocks.
- Commodities.
- Currency pairs.
- ETFs or CFDs, depending on availability.
Trading Bull Flags on Regional Stocks
Bull Flags may appear on stocks listed on exchanges such as Tadawul, DFM, or ADX.
The same technical principles may apply:
- Identify a strong prior move.
- Watch for controlled consolidation.
- Confirm breakout.
- Manage risk.
Any stock example should be treated as illustrative only and not a recommendation to trade any specific stock.
Regional stocks may have different liquidity, trading hours, price limits, and news drivers compared with global markets. These factors should be considered before trading.
Practising Bull Flag Analysis as an Evest Reader
Before considering any Bull Flag setup, turn the pattern into a repeatable analysis process rather than relying on visual appearance alone.
Start by marking:
- The beginning and end of the flagpole.
- The upper and lower boundaries of the flag.
- The breakout confirmation level.
- The level that would invalidate the pattern.
- The next major resistance area.
- The expected reward compared with the amount at risk.
Reviewing these points before making a decision can help separate a structured setup from an emotional reaction to a fast price move.
Evest educational content is designed to help readers understand how market structures are evaluated. It does not guarantee that a specific pattern, trade, or strategy will produce a profit.
FAQs
What is the Bull Flag Pattern’s success rate?
There is no fixed universal success rate for the Bull Flag Pattern. Its performance depends on several factors, including confirmation, timeframe, asset class, volume, market conditions, and risk management. Backtesting results may also vary depending on the rules used to define the pattern and the market being tested.
How often do Bull Flag Patterns occur?
Bull Flag Patterns are relatively common in trending markets, especially during strong uptrends. They appear less frequently in sideways or choppy markets. Their frequency also depends on the asset’s volatility and the timeframe being observed.
When do Bull Flag Patterns fail?
Bull Flag Patterns may fail when the breakout lacks volume, the price falls back into the flag, the consolidation becomes too deep, or unexpected news changes market sentiment. They may also fail when the breakout occurs directly below a major resistance level, which can limit further upside movement.
How long can Bull Flags last?
The duration of a Bull Flag depends on the timeframe being analyzed. On intraday charts, a Bull Flag may last minutes or hours, while on daily charts, it may last several days or weeks. If the consolidation lasts too long or becomes too deep, the continuation setup may weaken.
Is a Bull Flag Pattern a continuation or reversal pattern?
The Bull Flag Pattern is generally classified as a bullish continuation pattern. It suggests a temporary pause within an existing uptrend before the price may continue higher. However, it is not a reversal pattern and does not guarantee that the uptrend will continue.
What technical analysis indicators are used with Bull Flags?
Traders often use volume, RSI, MACD, moving averages, Bollinger Bands, ATR, and support and resistance levels with Bull Flag setups. However, volume and price structure are usually more important than relying on indicators alone, as they help confirm whether the breakout has real strength.
What timeframe of price charts do Bull Flag Patterns form on?
Bull Flag Patterns can form on any timeframe, from minute charts to weekly or monthly charts. Longer timeframes may provide cleaner signals and reduce market noise, while shorter timeframes may produce more frequent setups but also more false breakouts.
What is the difference between a Bull Flag and a Bull Pennant?
A Bull Flag usually forms as a small rectangular or slightly downward-sloping channel after a strong rally. A Bull Pennant forms as a small symmetrical triangle after a strong rally. Both are continuation patterns, but the main difference is the structure of the consolidation phase.