
Backtesting trading strategies helps traders evaluate trading ideas before applying them in live market conditions. By using historical market data, traders can test entry, exit, position-sizing, and risk-management rules to understand how a strategy may have performed in the past. A backtest can reveal potential drawdowns, trading costs, weak rules, and changes in performance across different market environments. Through Evest, traders can use backtesting as a structured validation step before demo testing, while remembering that historical results do not guarantee future returns or remove the risks involved in trading financial markets.
What Is Backtesting?
Backtesting is the process of applying predefined entry, exit, position-sizing, and risk-management rules to historical market data. The objective is to estimate how the strategy might have behaved under past market conditions and identify weaknesses before moving to forward or demo testing. In this context, backtesting trading strategies helps traders understand whether their approach is measurable, repeatable, and suitable for further testing.
A reliable backtest is based on clearly defined rules. If two traders can interpret the same setup differently, the test may not be consistent enough to produce meaningful results.
The strategy should therefore state exactly when a trade is opened, when it is closed, how the position is sized, and how risk is controlled.
Why Is Backtesting Important?
Understanding why backtesting is important can prevent traders from relying on ideas that have never been tested against different market conditions.
- It provides a structured way to review a strategy before real capital is involved. For Evest users, backtesting trading strategies can support a more disciplined approach to market analysis and risk assessment.
- The main benefits include evaluating a trading idea using historical data, measuring potential drawdowns and risk exposure, identifying unclear or inconsistent trading rules, comparing performance across different time periods, estimating the effect of spreads, commissions, swaps, and slippage, and deciding whether a strategy deserves further demo testing.
Backtesting does not remove risk. It helps traders assess whether the logic behind a strategy is clear, measurable, and supported by a sufficiently broad sample of historical trades.
Backtesting vs. Forward Testing and Demo Trading
| Method | What It Does | Primary Purpose |
| Backtesting | Applies a trading strategy to historical market data to evaluate how it would have performed in the past. It can analyze months or years of data in a relatively short time. | Assess the historical performance of a strategy and identify strengths or weaknesses before live testing. |
| Forward Testing | Tests the strategy on data that was not used during development or optimization, either through out-of-sample historical data or newly emerging market data. | Verify whether the strategy remains effective on unseen data and reduce the risk of overfitting. |
| Demo Trading | Executes the strategy in a simulated trading account using live market prices, allowing traders to experience real-time market conditions without risking capital. | Compare real-time execution, spreads, and signal timing with backtesting assumptions before trading with real funds. |
How to Backtest a Trading Strategy in 5 Steps?
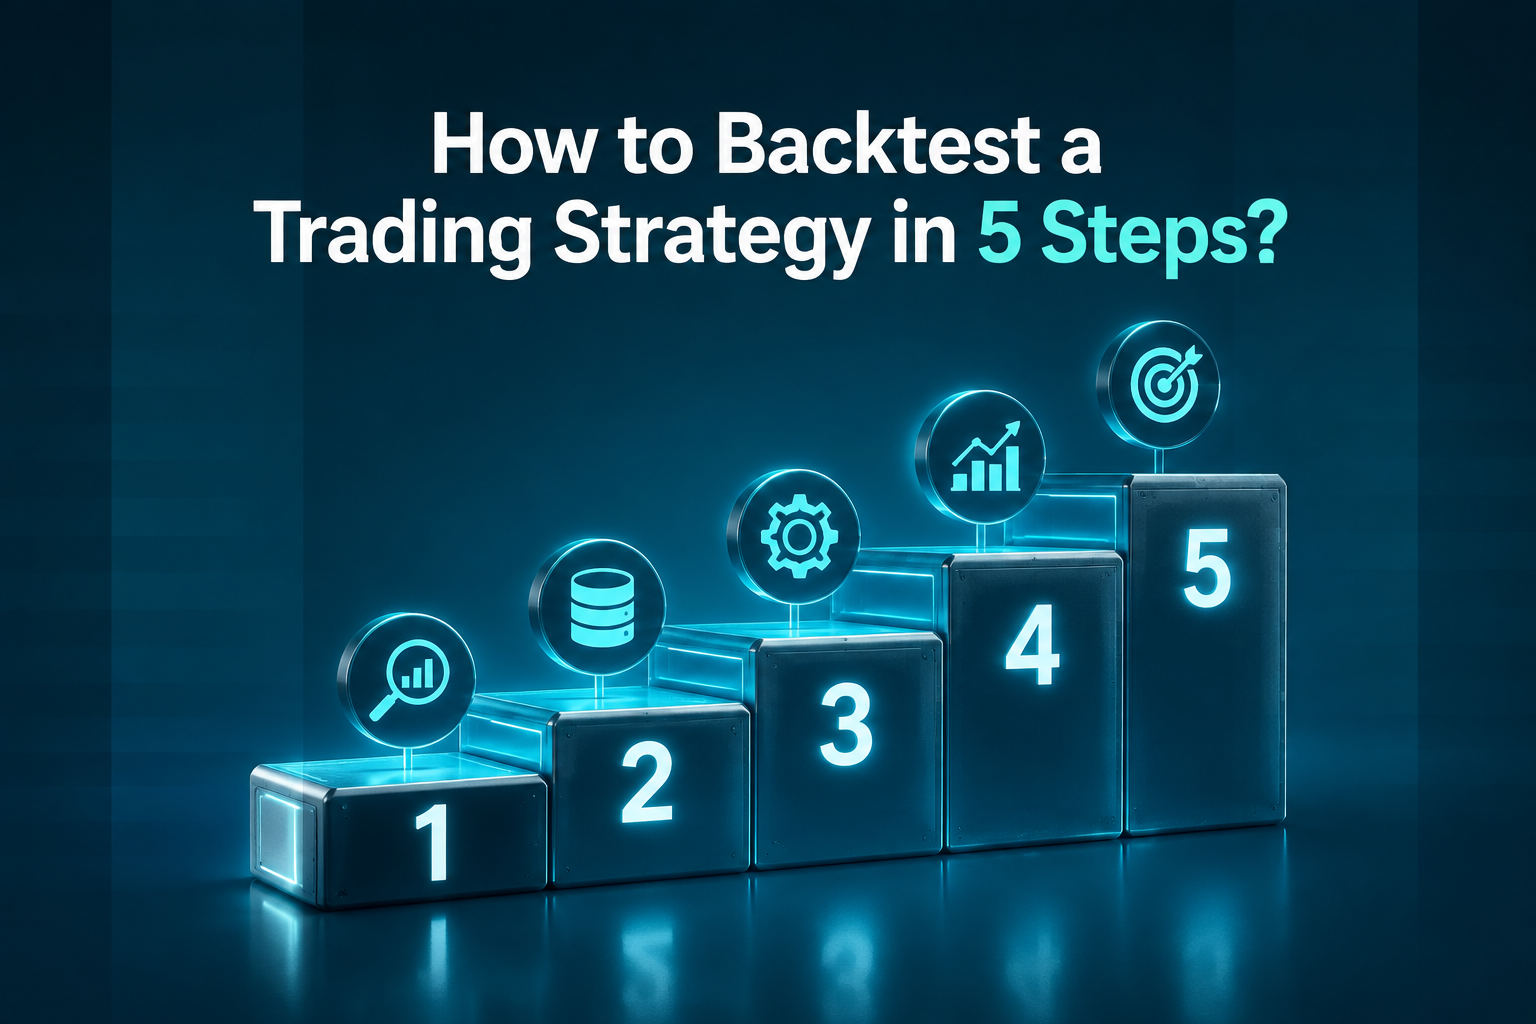
A reliable backtest requires a repeatable process. Start by defining objective rules, select appropriate historical data, run the test using manual or automated methods, review the main performance metrics, and validate the results using data that was not used to develop the strategy. When backtesting trading strategies, each stage should be recorded clearly so the trader can review the logic, assumptions, and results later.
Before moving into the five steps, traders should remember that a backtest is only useful when the rules are applied consistently. Clear documentation, realistic assumptions, and careful review help turn historical testing into a practical learning process rather than a simple performance snapshot.
- Define objective trading rules before starting the test.
- Select historical data that matches the instrument, timeframe, and market.
- Choose whether the strategy will be tested manually or automatically.
- Analyze performance using risk, return, drawdown, and consistency metrics.
- Validate the strategy on unseen data before moving to demo testing.
Step 1: Define Objective Trading Rules
Write down every rule before starting the test. Your strategy should specify the traded instrument, the timeframe, the entry signal, the exit signal, the stop-loss method, the profit target or exit condition, the position-sizing method, the maximum risk allowed per trade, and any conditions that prevent a trade from being opened.
For example, instead of writing “buy when the market looks oversold,” use a measurable rule such as: enter a long position when the 14-period Relative Strength Index crosses above 30 after the candle closes.
The same level of detail should apply to exits. A strategy should explain whether a trade is closed at a fixed target, after an indicator signal, at the end of a session, or through a trailing stop.
Rules that depend heavily on interpretation can produce inconsistent manual test results and cannot be tested reliably by automated software.
Step 2: Select Relevant Historical Market Data
Use historical data that matches the instrument, market, and timeframe covered by your strategy. The testing period should include different market environments, such as trending, ranging, higher-volatility, and lower-volatility periods.
Before running the test, review:
- Data completeness, including missing candles, price gaps, or incorrect values.
- Timeframe consistency with the trading rules.
- Market conditions, including trending, ranging, volatile, and quiet periods.
- Bid and ask prices where realistic spread differences are available.
- Trading costs such as commissions, swaps, and possible slippage.
- Instrument specifications, including contract size, trading hours, and minimum price movements.
The amount of historical data required depends on the strategy’s frequency and the variety of market conditions covered.
A low-frequency strategy may require a longer testing period than a strategy that generates several trades each week.
Step 3: Choose Manual or Automated Backtesting
Manual backtesting involves reviewing historical charts one candle at a time and recording every valid trade in a spreadsheet or trading journal.
It is suitable for beginners, price-action strategies, and systems that include a limited degree of trader discretion.
Automated backtesting converts the strategy rules into a systematic process and tests them across a larger historical dataset. It is more efficient for systematic strategies, frequent trading signals, and repeated parameter testing.
Whichever method you use, record the same information for every trade, including entry and exit prices, trade direction, stop-loss and profit target, position size, spread, commission, and slippage assumptions, profit or loss, reason for entry and exit, date, and market condition.
Backtesting tools can process information quickly, but their output is only as reliable as the strategy rules, historical data, and cost assumptions entered into the test.
Step 4: Analyze the Backtesting Results
Do not evaluate a strategy based on total profit alone. Review profitability, risk, consistency, and the number of trades included in the sample.
Important metrics include net return, which is the result after estimated trading costs; maximum drawdown, which is the largest decline from an equity peak to a subsequent low; profit factor, which is gross profits divided by gross losses; expectancy, which is the estimated average profit or loss per trade; win rate, which is the percentage of trades that closed profitably; average win-to-loss ratio, which compares the average winning trade with the average losing trade; trade count, which shows the number of observations supporting the results; and the equity curve, which shows the development and stability of results over the testing period.
A strategy with a high return but an unacceptable drawdown or a very small trade sample may not be sufficiently reliable for further testing.
Step 5: Validate the Strategy on Unseen Data
Divide the available historical data into two parts. Use the first part to develop or adjust the strategy and reserve the second part for out-of-sample testing.
If the strategy performs well only on the development data but fails on the unseen period, it may be overfitted.
You can also test its robustness by making small changes to parameters, spreads, execution costs, or testing dates.
The objective is not to reproduce identical results in every test. It is to determine whether the strategy remains reasonably consistent when the assumptions or market period change.
Manual Backtesting Example
The following simplified example shows how a trader might organize a manual test. It is an illustration, not a trading recommendation. This example also shows why backtesting trading strategies should be based on written rules rather than memory or personal interpretation.
Strategy Rules
The instrument is EUR/USD, and the timeframe is a one-hour chart. The entry rule is to open a long position when the 14-period RSI crosses above 30 after the candle closes. The stop loss is placed below the most recent swing low. The exit rule is to close the position when the RSI reaches 60 or when the stop loss is triggered. The risk rule is to use the same predefined risk percentage for every test trade. Costs should include the spread and an estimated slippage allowance.
The trader then moves through the historical chart candle by candle without looking ahead. Every valid setup is recorded in a spreadsheet.
At the end of the sample, the trader calculates the win rate, average win, average loss, maximum drawdown, profit factor, expectancy, and the result after estimated costs.
This process helps the trader identify whether the rules are clear enough to reproduce, whether the strategy depends on a small number of successful trades, and how it behaves during different market conditions.
Key Backtesting Metrics Explained
Understanding the main metrics can help traders move beyond surface-level results. A profitable historical test may still carry high risk, weak consistency, or unrealistic cost assumptions, so each metric should be reviewed as part of the full strategy evaluation process.
Profit Factor
Profit factor is calculated by dividing gross profits by gross losses.
Profit Factor = Gross Profit ÷ Gross Loss
A value above 1 means that gross profits exceeded gross losses during the selected test.
However, no single value proves that a strategy is reliable. Profit factor should be reviewed alongside drawdown, trade count, average win-to-loss ratio, transaction costs, and out-of-sample performance.
Expectancy
Expectancy estimates the average amount a strategy gained or lost per trade during the test.
Expectancy = (Win Rate × Average Win) − (Loss Rate × Average Loss)
A positive expectancy suggests that the tested combination of win rate and average trade outcome was profitable during the selected period. It does not guarantee that the relationship will continue.
Win Rate and Average Win-to-Loss Ratio
Win rate is the percentage of profitable trades in the sample. A high win rate can still produce an overall loss if losing trades are much larger than winning trades.
Similarly, a strategy with a lower win rate may remain profitable if its average winning trade is sufficiently larger than its average losing trade.
These two metrics should always be interpreted together.
Maximum Drawdown
Maximum drawdown measures the largest peak-to-trough decline in the strategy’s equity curve during the test. It helps traders assess how much capital the strategy lost during its worst historical period.
Drawdown should be reviewed in both monetary and percentage terms. Traders should also examine how long the strategy took to recover from the decline.
Trade Count and Sample Quality
A result based on a small number of trades can be heavily influenced by one or two unusual outcomes.
There is no universal minimum number of trades that applies to every strategy, but the sample should be broad enough to cover different market conditions and avoid relying on isolated results.
The quality of the observations matters as much as the number. A large sample built from inaccurate data or inconsistent rules can still produce misleading conclusions.
Account for Spreads, Commissions, and Slippage
Transaction costs can materially change backtesting results, particularly for strategies that open many positions or target relatively small price movements.
A realistic test should account for the bid-ask spread, applicable commissions, overnight financing where relevant, and potential slippage between the requested and executed price.
Avoid using one fixed cost assumption for every market condition if the selected testing platform allows variable spreads or execution settings.
If a strategy becomes unprofitable after realistic trading costs are included, its original results may not provide a practical representation of its potential performance.
Common Backtesting Mistakes
Many backtesting errors happen because traders focus on the final result instead of the process behind it. A strong historical return can be misleading if the test used incomplete data, changed rules, ignored costs, or relied only on favorable market conditions.
Common mistakes traders should avoid include:
- Overfitting the historical data by adding too many conditions or indicators.
- Using information that would not have been available at the time of the trade.
- Testing only during market conditions that favor the strategy.
- Ignoring spreads, commissions, swaps, slippage, and liquidity.
- Changing the rules during the test after seeing future candles.
Overfitting the Historical Data
Overfitting happens when a strategy is adjusted repeatedly until it matches the selected historical sample exceptionally well.
The resulting rules may capture random patterns rather than repeatable market behavior.
Common signs include too many indicators or conditions, parameters selected only because they produced the highest historical result, strong in-sample performance followed by weak out-of-sample performance, and a result that changes dramatically after a small parameter adjustment.
To reduce this risk, keep the rules as simple as possible, reserve unseen data for validation, and test whether small changes cause the entire result to collapse.
Look-Ahead Bias
Look-ahead bias occurs when a test uses information that would not have been available at the moment the trade decision was made.
For example, a manual tester may accidentally use the final shape of a candle before the candle had actually closed. An automated test may also reference incorrectly aligned data.
During manual testing, move through the chart without revealing future candles. During automated testing, review how indicators and data series are calculated.
Testing Only Favorable Market Conditions
A strategy may appear successful when tested only during a strong trend or a period that suits its rules.
This does not show how it behaves during ranges, volatility changes, or adverse conditions.
Use a testing period that includes varied environments. Results should also be reviewed by year, month, instrument, or market regime where possible.
Ignoring Trading Costs and Liquidity
A backtest that ignores spread, commissions, swaps, and slippage can significantly overstate performance.
This issue is especially important for high-frequency strategies and systems with small average profits per trade.
Tests should also avoid assuming that every position can be opened or closed instantly at the desired price, regardless of market conditions.
Changing the Rules During the Test
Changing an entry or exit rule after seeing the next candles introduces hindsight into the test.
The strategy should be written before the test begins and applied consistently to every valid setup.
Any rule change should create a new version of the strategy and a new test rather than being applied selectively to earlier trades.
How to Choose the Best Backtesting Method?
The best backtesting method depends on the strategy rather than the popularity of the tool. Before selecting a method for backtesting trading strategies, consider the following factors:
- Testing approach: Decide whether the strategy will be tested manually or through automated software.
- Market compatibility: Ensure the method supports the instruments and timeframes relevant to your strategy.
- Historical data quality: Verify that sufficient, accurate, and detailed historical data is available.
- Cost simulation: Check whether the method can account for spreads, commissions, slippage, and other trading costs.
- Technical requirements: Determine whether programming knowledge is required to build or modify the strategy.
- Performance reporting: Review the metrics, statistics, and reports generated after each test.
- Validation features: Look for support for out-of-sample testing and parameter adjustments to evaluate strategy robustness.
How to Backtest a Trading Strategy with Evest?
Evest users can approach backtesting through a structured workflow that focuses on strategy rules, historical data, realistic costs, and performance review. For traders interested in backtesting trading strategies with Evest, the goal is to evaluate whether a strategy’s logic is clear enough for further testing before any decision involving real capital.
The process allows users to select an instrument, timeframe, testing period, and relevant assumptions before reviewing the resulting trades and performance report.
A general testing workflow includes opening the testing environment, selecting the automated strategy or rule-based method, choosing the instrument and timeframe, setting the historical testing period, reviewing the execution and modeling settings, running the test, analyzing the report, equity curve, drawdown, and trade list, and repeating the test using different periods or out-of-sample data.
The settings should reflect the strategy’s actual rules and realistic trading costs.
After the historical test, the strategy should be evaluated in a demo environment before any decision involving real capital.
What to Do After Completing a Backtest?
A successful historical test does not mean that a strategy is ready for live trading. The next stage is forward testing in a demo environment using current market prices.
- Demo testing can help you compare real-time execution with the assumptions used in the backtest.
- Monitor spreads and potential slippage, trade timing, signal frequency, missed or delayed entries, differences in drawdown, and differences between the backtested and forward-tested equity curves.
- If the strategy behaves materially differently during demo testing, investigate the cause before considering any further stage.
- Backtesting, out-of-sample validation, and demo testing should work as consecutive checks rather than separate guarantees of future performance.
Limitations of Backtesting
Backtesting uses historical information and cannot predict future market performance. Even when the testing process is done carefully, market structure, liquidity, volatility, spreads, and correlations can change after the selected testing period.
A historical simulation may also differ from actual execution because of slippage, order delays, rejected orders, incomplete data, or inaccurate cost assumptions.
It cannot fully reproduce the emotional pressure or decision-making errors that may occur when real capital is involved.
For this reason, backtesting results should be treated as an estimate based on specific rules and historical conditions, not as a forecast or guarantee of future returns.
FAQs
How to Backtest a Trading Strategy?
To backtest a trading strategy, start by defining clear entry, exit, position-sizing, and risk management rules. Then choose reliable historical data, include realistic trading costs, and test the strategy manually or through backtesting software. After that, review performance metrics and validate the results on unseen data before demo trading.
How Many Trades Should a Backtest Include?
There is no fixed number of trades that works for every backtest. The sample size depends on the strategy’s frequency, holding period, traded market, and market conditions covered. A useful backtest should include enough trades to avoid judging performance based on only a few unusually profitable or losing positions.
Can You Backtest a Discretionary Strategy?
Yes, a discretionary strategy can be backtested, but the subjective parts must be documented clearly. Manual backtesting is often better when the setup depends on chart context or trader judgment. Traders should record screenshots, explain why each trade met the rules, and keep the evaluation process consistent across all examples.
What Is a Good Profit Factor in Backtesting?
A profit factor above 1 means gross profits were higher than gross losses during the selected test. However, this number alone does not prove that a strategy is reliable. Traders should review it alongside drawdown, number of trades, win-to-loss ratio, transaction costs, and out-of-sample performance before making decisions.
How Can You Identify an Overfitted Backtest?
An overfitted backtest usually performs very well on the data used to build the strategy but fails on new market data. Warning signs include too many parameters, extremely precise settings, and major performance changes after small adjustments. Testing the strategy on unseen data helps reveal whether results are reliable.
Can You Backtest a Trading Strategy Online?
Yes, traders can backtest a trading strategy online using charting platforms or browser-based backtesting tools. These tools may allow users to review historical prices or run strategy scripts. Before relying on any method, traders should check data quality, available markets, trading cost assumptions, and rule compatibility.