What Are the Most Common Trading Mistakes and How Can They Be Avoided?
Many traders fall into repeated mistakes that may cost them a lot,
but understanding these mistakes is the first step to avoiding them and achieving success in the markets.
Content
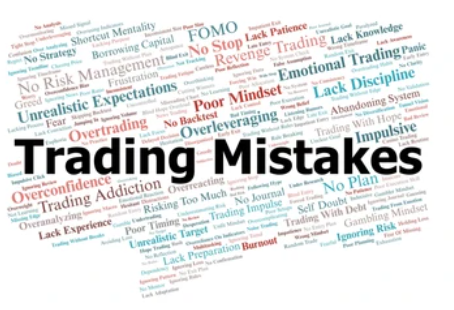
Most Common Trading Mistakes
Many traders, whether beginners or even professionals, face recurring challenges that often stem from avoidable mistakes.
Here are the most prominent ones:
- Emotional Trading
One of the most common mistakes, where the trader makes decisions based on emotions (fear or greed) instead of objective analysis.
This often leads to selling at lows or buying at highs, missing real profit opportunities. - Ignoring Risk Management
Entering large positions without using risk management tools like stop-loss orders exposes the account to significant risk.
Ignoring the risk-to-reward ratio results in accumulated losses. - Overtrading
Often a result of overconfidence or the urge to quickly recover losses.
Excessive number of trades can lead to mental fatigue and financial loss due to fees and volatility. - Relying Solely on Recommendations
Fully depending on recommendations from the internet or forums without understanding their analytical background puts the trader at risk,
especially if the recommendations do not align with their strategy. - Ignoring a Trading Plan
Lacking a clear trading plan – including entry and exit points and capital management – leads to random decisions and unpredictable results.
How to Avoid These Mistakes
Success in trading doesn’t only require market analysis skills, but also mental discipline and commitment to a clear plan.
Here are effective steps to avoid the above mistakes:
- Create a Written Trading Plan
Define your strategy in advance, and write down entry points, stop-loss levels, and targets.
Review your performance regularly to improve the plan based on results. - Stick to Capital Management
Allocate a small portion of your capital to each trade (e.g., 1%-2%), and ensure that each trade justifies the risk based on expected return. - Control Your Emotions
Train yourself to stay calm even during losses or sudden gains.
Using demo accounts or automated trading can help manage emotions. - Commit to Continuous Learning
Dedicate time to learning through courses, books, and reviewing your past trades.
Mistakes are not the end but an opportunity to enhance performance. - Don’t Follow the Herd
Trust your own analysis and don’t enter trades just because “everyone is doing it.”
Rely on data, technical analysis, and credible news—not rumors.
Professional Analysis
A professional trader relies on an integrated system of mental discipline, capital management, and strategic adherence.
Yet they remain vulnerable to subtle mistakes that arise from overconfidence or misjudging liquidity shifts and volatility.
For example, excessive reliance on a previously successful technical model may lead to ignoring negative signals in the current context,
putting the trader in poorly calculated positions.
Additionally, ignoring intermarket relationships—such as the effect of bond yields or currency movements—may result in fragmented decisions.
Thus, developing a dynamic approach to continually reassess the analytical model,
and monitoring performance with quantitative data (such as win/loss ratio and deviations from the trading plan),
becomes essential to avoid recurring mistakes—even for the experienced.
Conclusion
In conclusion, recognizing trading mistakes is not a sign of weakness but a mark of maturity and readiness for continuous improvement.
Every mistake is an opportunity to learn and develop a more balanced and professional approach.
With systematic analysis, mental discipline, and conscious risk management,
you move one step closer to sustainable success in the financial markets.
What Are the Most Common Trading Mistakes and How Can They Be Avoided?