
Sputnik Arabic

Arqam Plus

Fear and Greed Index Explained: How It Measures Market Sentiment?
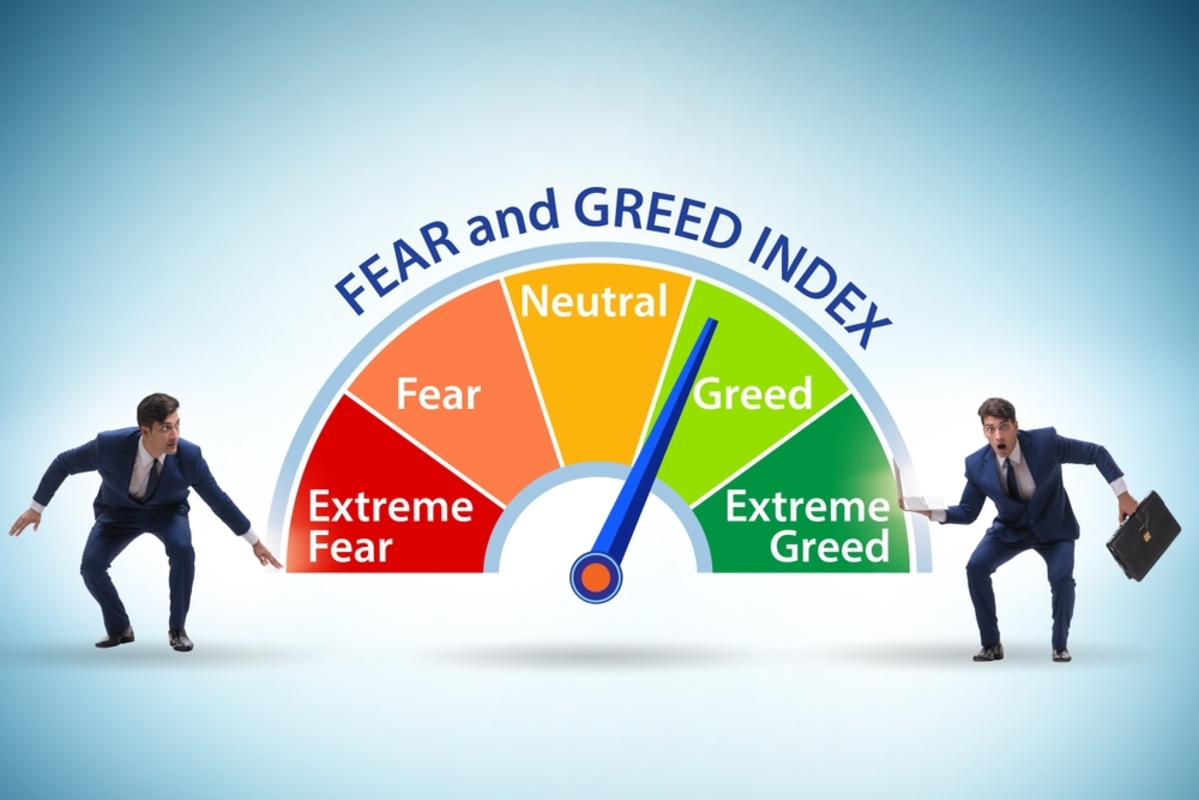
The financial markets are often driven not only by data and fundamentals, but also dominated by fear or greed. One of the most widely used tools to measure these emotions is the fear and greed index, which reflects whether the market is dominated by fear or excessive optimism. This index helps traders understand the overall sentiment and potential direction of market movements.
By analyzing emotional extremes, investors can identify possible buying or selling opportunities. Ultimately, it serves as a guide to balance emotional decision-making with rational analysis in trading.
What Is the Fear and Greed Index?
The fear and greed index is a widely used sentiment indicator designed to measure market psychology by tracking extreme emotions among investors. Developed as a tool to gauge whether traders are overly optimistic or pessimistic, it provides valuable insights into market behavior beyond traditional technical or fundamental analysis. At its core, the index quantifies the collective emotional state of the market, helping investors identify potential turning points before they occur.
Unlike traditional indicators that rely on price movements or economic data, the fear and greed index focuses on psychological factors—such as panic selling or euphoric buying—that often precede market shifts. For example, when the index signals “extreme fear,” it may suggest that assets are undervalued due to irrational selling, while “extreme greed” could indicate overvalued markets ripe for correction. This duality makes it particularly useful for traders seeking to anticipate market sentiment-driven trends.
Why Was It Created?
The creation of the fear and greed index stemmed from a fundamental observation: markets are not always rational. While economic models assume investors make decisions based on logic and data, reality often reveals that emotions—fear, greed, panic, and euphoria—play a dominant role in trading behavior. The index was developed to quantify these emotional drivers and provide a measurable framework for understanding market psychology.
Before its inception, traders relied on anecdotal evidence or qualitative assessments to gauge sentiment. However, these methods lacked consistency and objectivity. The fear and greed index was introduced as a systematic way to track these emotions, offering a standardized metric that could be applied across different markets and timeframes. By doing so, it bridged the gap between subjective sentiment analysis and data-driven decision-making.
How Does the Fear and Greed Index Work?
The Fear and Greed Index is a market sentiment tool that combines multiple indicators to measure whether investors are driven more by fear or greed in the financial markets.
- The index aggregates data from several market indicators, each representing a different aspect of investor behavior and sentiment.
- These indicators are weighted and combined to generate a single score ranging from 0 to 100.
- Lower values indicate extreme fear, while higher values reflect extreme greed in the market.
- The index updates in real time to reflect changing market conditions and investor emotions.
- It captures market psychology extremes, helping identify potential buying or selling pressure.
- When fear dominates, the index drops, often signaling possible buying opportunities.
- When greed dominates, the index rises, which may indicate overvaluation or speculative behavior.
- Reconcile the two statements or clarify the distinction.
- The index helps traders identify contrarian opportunities where market sentiment may reverse.
- It is a composite tool made up of multiple indicators rather than a single data source.
- The weighting of components may vary depending on the market or asset class being analyzed.
- This structure makes the index flexible and useful across different trading environments.
Components of the Index
The fear and greed index is composed of seven key components, each designed to capture a distinct aspect of market sentiment. These components are:
- Market Momentum
- Volatility
- Safe Haven Demand
- Put and Call Options
- Market Breadth
- Junk Bond Demand
- Stock Price Breadth
Market Momentum
Market momentum measures the strength and direction of recent market movements. A strong upward momentum suggests confidence among investors, while declining momentum may indicate growing pessimism. This component is particularly useful for identifying trends and potential reversals.
Volatility
Volatility reflects the degree of price fluctuations in the market. High volatility often accompanies extreme emotions—either fear during sharp declines or greed during rapid rallies. By tracking volatility, the index can signal when market participants are becoming overly cautious or overly optimistic.
Safe Haven Demand
Safe haven demand assesses the flow of capital into traditionally safe assets, such as gold or government bonds. During periods of uncertainty, investors flock to safe havens, reducing demand for riskier assets. This component helps identify when fear is driving market behavior.
Put and Call Options
The ratio of put to call options provides insight into whether investors are hedging against downside risk (puts) or betting on further gains (calls). A high put-to-call ratio often signals fear, while a low ratio may indicate greed.
Market Breadth
Market breadth measures the participation of individual stocks in a market’s overall movement. A broad rally with widespread participation suggests strong confidence, whereas a narrow rally with limited participation may indicate speculative behavior.
Junk Bond Demand
Junk bond demand reflects the appetite for high-risk, high-reward investments. When investors are willing to take on greater risk, it often signals greed. Conversely, a decline in junk bond demand may indicate fear.
Market Breadth
Market Breadth evaluates the number of stocks hitting new highs versus new lows. A high number of new highs suggests bullish sentiment, while an increase in new lows may signal bearishness.
Interpretation of index levels
The Fear and Greed Index is used to measure overall market sentiment by showing how investors are feeling at different stages of the market cycle, ranging from extreme fear to extreme greed.
Extreme Fear
This level indicates that investors are highly pessimistic and strongly risk-averse. Markets are often oversold during this stage, which may create potential buying opportunities for long-term investors.
Fear
At this stage, uncertainty dominates the market, and many investors start selling or avoiding risk. Prices may be under pressure, but it can also signal that negative sentiment is already priced in.
Neutral
A neutral reading reflects a balanced market where neither fear nor greed is dominant. It often suggests that the market is in a consolidation phase with no strong directional bias.
Greed
Greed indicates growing investor optimism and increased buying activity. While this can support upward price momentum, it may also signal that assets are becoming overvalued.
Extreme Greed
This is the highest level of optimism, where investors may be overly confident and speculative. It often appears near market tops and can be a warning of a possible correction or reversal.
How do traders and investors use the index?
The Fear and Greed Index is widely used by traders and investors as a sentiment-based tool to better understand market psychology and improve decision-making in different market conditions.
Timing Market Entries and Exits
Traders use the index to identify potential entry and exit points in the market. When the index shows extreme fear, it may signal a possible buying opportunity, while extreme greed can indicate a good time to take profits or reduce exposure.
Risk Management
Investors rely on the index to adjust their risk levels depending on market sentiment. During high fear or extreme greed phases, they may reduce position sizes, diversify portfolios, or increase hedging strategies to protect capital.
Sentiment Confirmation Tool
The index is also used as a confirmation tool alongside technical or fundamental analysis. It helps traders validate whether market sentiment supports their trading decisions or if the market may be overreacting in one direction.
Limitations of the Fear and Greed Index
The Fear and Greed Index is a useful sentiment indicator, but like any financial tool, it has certain limitations that traders should understand before relying on it for decision-making. It works best when combined with other forms of analysis rather than being used alone.
Not a Standalone Prediction Tool
The index should not be used as the only basis for predicting market movements. It reflects current investor sentiment but does not guarantee future price direction. Successful traders often combine it with technical and fundamental analysis—something that can be easily done using advanced trading platforms like Evest, which provide integrated tools for smarter decision-making.
Lagging vs Leading Signals
In many cases, the Fear and Greed Index acts as a lagging indicator because it reacts to existing market conditions rather than predicting future changes. This means it may confirm trends that are already in motion instead of signaling them early. Therefore, investors should use it as a supportive tool rather than a primary forecasting method.
FAQs
Who created the Fear and Greed Index?
The Fear and Greed Index was originally developed by CNN Business to measure investor sentiment in the financial markets. It was designed to help investors understand whether emotions like fear or greed are driving market behavior.
What factors are included in the Fear and Greed Index?
The index includes several factors such as market momentum, volatility, trading volume, put and call options, safe-haven demand, market breadth, and junk bond demand. Each factor reflects a different aspect of investor behavior and market sentiment.
How is the Fear and Greed Index calculated?
The index is calculated by combining and weighting multiple market indicators into a single score ranging from 0 to 100. Lower values represent extreme fear, while higher values indicate extreme greed in the market.
What are the three types of market movements?

Understanding market movements is essential for anyone involved in trading or investing, as it reflects the constant changes in asset prices over time. These movements are driven by a combination of economic data, investor sentiment, and global events that influence supply and demand. By analyzing price fluctuations, traders can identify potential opportunities and risks in the financial markets.
It also helps in making more informed decisions rather than relying on speculation. Ultimately, studying market behavior allows investors to better anticipate possible future trends.
Definition of Market Movements
Market movements refer to the fluctuations in financial markets, including stocks, bonds, commodities, and currencies, driven by supply and demand dynamics. These movements can occur over different timeframes—from daily market movements that reflect intraday volatility to long-term trends shaping investor sentiment. At its core, the meaning of market movement lies in how prices adjust based on real-time data, economic shifts, and investor behavior. For example, a sudden spike in oil prices can trigger a chain reaction across global markets, illustrating how interconnected these movements are.
Evest Price Fluctuations: The most visible aspect of market movements, where asset prices rise or fall based on trading activity.
Evest Volume Changes: The number of shares or contracts traded, which can amplify or dampen price swings.
Evest Trend Directions: Whether markets are trending upward (bullish), downward (bearish), or moving sideways (consolidation).
Evest Liquidity Shifts: How easily assets can be bought or sold without affecting their price, which impacts movement stability.
Why They Matter in Finance and Investing?
Market movements are the heartbeat of finance, dictating how wealth is created, preserved, or lost. For investors, these movements determine portfolio performance, risk exposure, and long-term growth strategies. Ignoring them is akin to navigating a storm without a compass—reacting to market movements without context can lead to costly mistakes. Here’s why they are critical:
- Opportunity Identification: Rising markets may signal buying opportunities, while declines can highlight assets to avoid or short-sell.
- Risk Assessment: Volatile movements often precede economic downturns, allowing investors to hedge or diversify proactively.
- Portfolio Adjustments: Understanding trends helps in rebalancing portfolios to maintain desired risk levels.
- Behavioral Insights: Movements reveal investor sentiment, such as panic selling during crashes or euphoric buying in bubbles.
For example, during the 2020 COVID-19 crash, share market movement volatility exceeded 30% in some indices, but savvy investors who recognized the temporary nature of the decline were able to capitalize on subsequent rebounds. Platforms like Evest provide resources to decode these signals, helping investors align their strategies with market realities.
Key Drivers of Market Movements
Market movements are rarely random; they are shaped by a complex interplay of factors that can be categorized into economic, corporate, and external drivers. Each of these influences moves markets in distinct ways, often overlapping to create compound effects. Below are the primary forces behind market movements:
Economic Indicators
Economic data releases act as catalysts for market shifts. Investors closely monitor:
- GDP Growth: Strong GDP figures typically boost stock markets, while contractions signal caution.
- Unemployment Rates: Rising unemployment can trigger sell-offs, as it reflects weakening consumer spending.
- Consumer Confidence: Surveys like the University of Michigan’s index influence spending and corporate revenues.
- Purchasing Managers’ Index (PMI): A PMI above 50 indicates expansion, while a PMI below 50 suggests contraction.
- Evest Inflation Data: High inflation erodes purchasing power, prompting central banks to raise interest rates, which can dampen market growth.
- Evest Retail Sales: Strong retail numbers suggest robust economic activity, often leading to bullish trends.
- Evest Housing Starts: A barometer for construction and consumer confidence, impacting related sectors like materials and appliances.
- Evest Trade Balances: Deficits or surpluses in trade can influence currency values and export-driven stocks.
Interest Rates and Inflation
Central banks, such as the Federal Reserve or the European Central Bank, wield immense power over markets through monetary policy. Their decisions on interest rates directly impact borrowing costs, corporate profits, and investor returns.
- Rate Hikes: Higher rates increase borrowing costs for businesses and consumers, often leading to lower stock valuations.
- Rate Cuts: Lower rates stimulate economic activity, typically benefiting growth stocks and sectors like real estate.
- Inflation Expectations: If markets anticipate rising inflation, they may demand higher yields on bonds, reducing their prices.
Global Events and Geopolitics
External shocks can send markets into tailspins, often overshadowing economic fundamentals. Geopolitical tensions, natural disasters, and policy changes create uncertainty that drives market movements. Key examples include:
- Trade Wars: Tariffs and trade restrictions, such as those between the U.S. and China, disrupt supply chains and corporate profits.
- Elections and Policy Shifts: Uncertainty around political outcomes can lead to volatile premarket movements as investors brace for potential changes.
- Natural Disasters: Events like hurricanes or pandemics disrupt production and consumer behavior, causing sharp market reactions.
- Sanctions and Embargoes: Geopolitical conflicts, such as Russia’s invasion of Ukraine, can trigger energy price spikes and global market sell-offs.
Types of Market Movements
Not all market movements are created equal. They vary in duration, intensity, and underlying causes, each requiring a different investment approach. Below are the primary types of market movements investors encounter:
Bull Markets vs Bear Markets
| Aspect | Bull Market | Bear Market |
| Definition | Rising prices, optimism, and strong economic growth | Falling prices, pessimism, and economic downturn |
| Market Characteristics | Prolonged upward trends, low volatility, and high liquidity | Prolonged declines (≥20%), high volatility, risk aversion |
| Investor Behavior & Strategy | Focus on growth stocks, long positions, and sector rotation into high-momentum areas | Shift to defensive assets like gold and cash, and use of short-selling strategies |
| Overall Psychology | Confidence and strong buying activity | Fear and selling pressure dominate |
| Key Difference | Rewards patience and long-term growth thinking | Tests discipline and risk management skills |
Volatility and Sideways Trends
| Aspect | Volatility | Sideways Trends (Consolidation) |
| Definition | Rapid and significant price swings driven by news events or liquidity shifts | Prices move within a narrow range due to market indecision |
| Types | Short-term volatility (intraday/weekly swings), long-term volatility (structural shifts like tech or regulation changes) | No formal types, but sideways trends often appear as accumulation or consolidation phases |
| Market Characteristics | High price movement, high risk, and opportunity, often unpredictable | Low volume, tight trading range, uncertainty dominates |
| Investor Impact | Can amplify both gains and losses, making risk management and hedging essential | Requires patience; often leads to breakout or breakdown moves |
| Investor Strategy | Use hedging strategies, active trading, and risk control techniques | Range trading, breakout strategies, or waiting for a clearer market direction |
Short-term vs. Long-term Movements
| Aspect | Short-Term Movements | Long-Term Movements |
| Definition | Driven by news, technical levels, or liquidity events such as premarket and intraday swings | Driven by broader economic cycles, demographics, and technological progress |
| Duration | Hours to weeks | Years to decades |
| Key Influences | Earnings reports, Federal Reserve decisions, macroeconomic surprises | Interest rate cycles, population growth, industry disruptions (e.g., AI, renewable energy) |
| Market Behavior | Fast and reactive price changes with higher short-term noise | Gradual structural trends and long-term directional shifts |
| Investor Focus | Day traders and swing traders target short-term opportunities | Long-term investors focus on sustained growth and macro trends |
How Investor Behavior Influences Markets?
Market movements are not solely driven by economic data or geopolitical events—they are also profoundly shaped by the collective psychology and actions of investors. Understanding how investor behavior influences markets is crucial for predicting trends, avoiding pitfalls, and capitalizing on opportunities. Below are the key psychological and behavioral factors that drive market movements:
Psychology and Sentiment
Investor sentiment refers to the overall attitude of market participants toward financial assets, which can swing between extreme optimism and deep pessimism. Sentiment is highly contagious and often amplifies market movements, leading to bubbles or crashes. Key aspects of sentiment include:
Optimism (Bullish Sentiment):
- Investors expect prices to rise, leading to increased buying.
- Often seen during economic expansions or when new technologies (e.g., cryptocurrencies, AI stocks) gain traction.
- Can result in overvaluation, where asset prices exceed fundamental worth (e.g., the dotcom bubble of the late 1990s).
Pessimism (Bearish Sentiment):
- Investors anticipate declines, triggering sell-offs and further downward pressure.
- Common during recessions, pandemics, or geopolitical crises (e.g., the 2008 financial crisis).
- May lead to undervaluation, where assets trade below intrinsic value, creating buying opportunities.
Fear and Greed:
- Fear drives panic selling, exacerbating declines (e.g., the 2020 COVID-19 crash).
- Greed fuels speculative bubbles, as investors chase quick profits (e.g., GameStop short squeeze in 2021).
- Tools like the Fear & Greed Index (e.g., CNN’s Fear & Greed Index) quantify these emotions in real time.
Herd Mentality:
- Example: Retail investors flooded into meme stocks.
- Example: Retail investors flooding into meme stocks (e.g., AMC, Bed Bath & Beyond) based on social media hype.
- Can create momentum effects, where assets rise or fall simply because others are buying or selling.
Tools Used to Analyze Market Movements
To navigate market movements effectively, investors rely on a combination of analytical tools and methodologies. These tools help decode trends, predict reversals, and manage risk. Below are the most widely used approaches:
Technical Analysis
Technical analysis focuses on studying price charts and historical market data to predict future price movements. Traders use patterns, trends, and indicators such as moving averages and RSI to identify entry and exit points.
Fundamental Analysis
Fundamental analysis examines the underlying value of an asset by analyzing economic, financial, and industry-related factors. This includes company earnings, interest rates, inflation, and overall economic conditions. Investors use this approach to determine whether an asset is overvalued or undervalued, making it more suitable for long-term investment decisions.
Market Indicators and Charts
Market indicators and charts are essential visual tools used to simplify market data interpretation. Charts such as candlestick and line charts display price movements over time, while indicators like volume, MACD, and Bollinger Bands help confirm trends and signals. These tools assist traders in making more accurate and data-driven trading decisions.
FAQs
What is the difference between bullish and bearish market movements?
Bullish market movements refer to rising prices and overall optimism, where investors expect continued growth. Bearish market movements refer to falling prices and pessimism, where selling pressure dominates the market.
Can market movements be predicted accurately?
Market movements cannot be predicted with complete accuracy due to the influence of many unpredictable factors. However, traders use analysis tools and indicators to improve the probability of making informed predictions.
How should investors respond to sudden market movements?
Investors should remain calm and avoid emotional decision-making during sudden market changes. It is better to rely on risk management strategies and stick to a well-defined trading plan.
How to identify trend direction in trading markets?

Understanding trend direction is the first step toward unlocking profitable trading opportunities, as they help traders align with market momentum. At their core, these markets are characterized by sustained price movements in a single direction—either upward or downward—rather than oscillating within a confined range.
Unlike sideways markets, where prices struggle to break out, trending markets create clear momentum that traders can leverage. For example, when Bitcoin surged from $30,000 to $70,000 in early 2024, it wasn’t just random volatility—it was a strong market trend behavior driven by institutional adoption and macroeconomic factors. The key lies in recognizing these trends early, as they often signal shifts in investor sentiment, liquidity, and economic conditions.
What Defines a Trend Direction?
A trending market isn’t just any price movement; it’s a structured shift in momentum that persists over time. To qualify, a trend must meet three critical criteria:
- Directionality: means the price is moving consistently higher or lower, not zigzagging.
- Persistence requires the trend to last for multiple sessions or weeks, not just hours.
- Confirmation comes from volume, technical indicators, or external factors such as news events. Without these, what looks like a trend could be a false breakout.
For example, the 2023 gold rally can be considered a case study. When gold broke above $2,000/oz and held, it wasn’t just a spike; it was the start of a market trend driven by geopolitical tensions and central bank purchases. The trend only solidified when volume surged, and technical indicators like the ADX confirmed strength. This is the difference between a fleeting move and a sustainable trend.
Key characteristics of trending markets
- Clear directional bias (up, down, or sideways)
- Higher highs/lows (uptrend) or lower highs/lows (downtrend)
- Increasing volatility as the trend matures
- Institutional participation (smart money flows)
1. Strong vs weak trends
Not all trends are created equal. A strong trend is one where price moves decisively with minimal pullbacks, often accompanied by high volume and extreme sentiment. Weak trends are characterized by sluggish movement, frequent reversals, and low conviction. For example, the 2021 meme stock frenzy (GameStop, AMC) was a weak trend because it lacked institutional backing and was driven purely by retail speculation. In contrast, the 2020 S&P 500 surge was strong, with consistent gains supported by Fed interventions and corporate earnings.
1. Signs of a strong trend
- Price extends beyond key resistance/support
- Volume spikes on breakouts
- Indicators show extreme readings (e.g., RSI >70 in uptrends)
2. Red flags of a weak trend
- Frequent false breakouts
- Low volume on moves
- Price struggles to close above/below key levels
2. Trending vs ranging markets
The battle between trending markets and ranging markets is a common challenge for traders. Ranging markets (or consolidations) occur when the price oscillates between support and resistance without a clear direction. These markets are ideal for mean-reversion strategies but deadly for trend traders. For example, the USD/JPY pair spent months in 2023 trading between 145 and 155 without a decisive break, frustrating trend followers.
How to spot the difference?
Trending: Price makes new highs/lows beyond previous extremes
Ranging: Price respects support/resistance repeatedly
Types of Market Trends
Market trends aren’t one-size-fits-all. They vary by duration, strength, and asset class, each requiring tailored strategies. Understanding these variations is crucial for adapting to changing conditions.
1. Uptrend (Bullish Market)
An uptrend is the trader’s dream scenario—a market where higher highs and higher lows create a staircase pattern. Bullish markets thrive on optimism, liquidity, and positive news cycles. For example, the Nasdaq’s 2023 rally was fueled by AI stock dominance and record-low interest rates. Traders in uptrends focus on buying pullbacks, using tools like moving averages to confirm the trend’s strength.
1. How to trade uptrends
Buy dips near moving averages (e.g., 50-day EMA)
Use volume spikes to confirm breakouts
Set stop-losses below recent swing lows
2. Common pitfalls
Chasing the trend without pullback confirmation
Ignoring overbought conditions (RSI >70)
Assuming the trend will last forever
2. Downtrend (Bearish Market)
Downtrends are the opposite—lower highs and lower lows create a death spiral. Bear markets are driven by fear, economic downturns, or policy shifts. The 2022 crypto crash is a textbook example, where Bitcoin fell from $69,000 to $16,000 in months. Short sellers and trend-following algorithms thrive here, but timing exits is critical to avoid getting trapped in reversals.
Key indicators for downtrends
- Price closes below moving averages
- Volume increases on down moves
- RSI <30 signals oversold conditions
3. Sideways (Non-trending Market)
Not all markets trend. Sideways markets, or consolidations, occur when buyers and sellers are evenly matched. These phases are exhausting for trend traders but lucrative for range traders. For instance, the S&P 500 spent 2023 in a tight range between 4,100 and 4,500, frustrating momentum strategies. Identifying these phases early is key—traders must switch from trend-following to mean-reversion tactics.
Short-term vs long-term trends
Understanding the difference between short-term and long-term trends is essential for choosing the right trading strategy, timing entries, and managing risk effectively. Each type of trend reflects different market forces and requires a different approach.
| Category | Short-Term Trends | Long-Term Trends |
| Duration | A few hours to several days (up to a week) | Weeks, months, or even years |
| Market Drivers | News events, earnings reports, market sentiment | Economic cycles, interest rates, global events |
| Volatility | High volatility and rapid price movements | More stable and consistent |
| Market Behavior | Frequent reversals and market noise | Less affected by short-term noise |
| Trend Strength | Less reliable direction | Stronger and more reliable direction |
| Trading Style | Day trading and swing trading | Position trading and investing |
| Strategy Focus | Quick entries and exits | Holding trades for longer periods |
| Indicators Used | RSI, MACD strategy, short-term moving averages | 100-day / 200-day moving averages + fundamentals |
| Monitoring | Requires constant market monitoring | Less frequent monitoring needed |
| Advantages | More opportunities, faster profit potential | More reliable, lower stress, better risk-to-reward |
| Disadvantages | Higher risk, more noise, needs fast decisions | Fewer opportunities, requires patience and capital |
How to Identify Trending Markets?
Identifying trending markets is one of the most important skills in trading. A trend shows the overall Directional Trading, and recognizing it early helps traders enter high-probability setups.
1. Price Action and Market Structure
Price action and market structure help you visually confirm whether the market is trending.
Key points:
- Look for higher highs (HH) and higher lows (HL) in an uptrend
- Look for lower highs (LH) and lower lows (LL) in a downtrend
- In a strong trend, price moves in a clear directional pattern
- Avoid markets where the price is moving sideways (no structure clarity)
How to identify a trend:
- Uptrend → consistent HH + HL formation
- Downtrend → consistent LH + LL formation
- Break of structure (BOS) confirms continuation or reversal
Why it matters:
- Shows who controls the market (buyers or sellers)
- Helps avoid false entries in sideways markets
2. Volatility and Momentum
Volatility and momentum measure the strength and speed of price movement.
Volatility:
- Refers to how much the price moves in a given time
- High volatility = strong movement and fast price changes
- Low volatility = weak or sideways market
Momentum:
- Measures the speed and strength of a trend
- Strong momentum = smooth directional movement
- Weak momentum = choppy and uncertain price action
How to identify a trending market:
- Strong directional candles (large bodies, few wicks)
- Price moves quickly in one direction
- Pullbacks are shallow and short-lived
Why it matters:
- Strong trends usually have high momentum
- Weak momentum often signals consolidation or reversal
3. Volume Analysis
Volume shows the level of participation in the market and helps confirm trends.
Key points:
- Increasing volume = strong trend confirmation
- Decreasing volume = weak or ending trend
- Volume spikes often occur during breakouts
How to identify a trend using volume:
- Uptrend: rising price + increasing volume
- Downtrend: falling price + increasing volume
- Breakout with high volume = strong trend continuation
Why it matters:
- Confirms whether a trend is real or fake
- Helps filter out false breakouts
- Shows institutional participation
Best Indicators for Trending Markets
While price action and volume are foundational, technical indicators provide additional confirmation. The best indicators for trending markets filter noise and highlight high-probability setups.
Moving Averages
Moving averages (MAs) are the backbone of trend-following strategies. They smooth out price data and act as dynamic support/resistance levels.
Identifying direction and dynamic support
Price above a moving average (e.g., 50-day EMA) confirms an uptrend
Price below a moving average confirms a downtrend
Example: The 200-day MA acts as a major support in uptrends (e.g., S&P 500 rarely closes below it for long)
Golden Cross (Bullish): 50-day MA crosses above 200-day MA
Death Cross (Bearish): 50-day MA crosses below 200-day MA
1. Which moving averages to use
- Short-term: 9-day or 10-day EMA (for intraday/swing trades)
- Medium-term: 20-day or 50-day EMA (for swing trades)
- Long-term: 100-day or 200-day SMA (for position trades)
- Volume-Weighted: VWAP (Volume-Weighted Average Price) for institutional confirmation
2. Common moving average mistakes
- Using only one MA (e.g., just the 50-day) without context
- Ignoring MA slopes (flat MAs signal weak trends)
- Entering trades when the price is too far from the MA (higher risk of pullbacks)
Relative Strength Index (RSI)
RSI measures momentum and identifies overbought/oversold conditions. While it’s often used for reversals, it’s equally valuable in trending markets to spot exhaustion.
Measuring momentum strength
- RSI > 70 in an uptrend: Overbought but not necessarily a reversal (check price action)
- RSI < 30 in a downtrend: Oversold but may continue lower (wait for bullish divergence)
- Bullish Divergence: Price makes lower lows, RSI makes higher lows
- Bearish Divergence: Price makes higher highs, RSI makes lower highs
RSI settings for trends
- Standard (14-period): Best for swing trading
- Shorter (9-period): For intraday momentum confirmation
- Longer (21-period): For long-term trend strength
- Stochastic RSI
Trending Markets Across Asset Classes
Trending markets can appear in all financial asset classes, but each market behaves differently based on its structure, drivers, and volatility. Understanding how trends form in each asset class helps traders choose the right strategy and manage risk effectively.
1. Forex Market Trends
Forex trends are driven by macroeconomic factors such as interest rates, inflation, and central bank policies. Major currency pairs like EUR/USD and GBP/USD often show clear directional moves. Currency strength and indices help traders compare performance, while economic indicators like GDP and employment data can significantly shift market trends.
2. Stock Market Trends
Stock market trends reflect economic conditions and investor sentiment. Major indices like the S&P 500 and global markets indicate overall direction. Growth stocks tend to outperform in bullish conditions, while value stocks may lead in uncertain markets. Market movers, including top gainers and losers, highlight short-term opportunities.
3. Cryptocurrency Trends
Cryptocurrency markets are highly volatile and trend-driven. Market capitalization trends indicate overall market strength, while certain coins experience extreme price swings. Crypto cycles alternate between bull and bear markets, often influenced by adoption, regulation, and investor sentiment.
4. Commodities and Futures Trends
Commodity trends depend on supply and demand dynamics. Energy markets like oil and gas are influenced by geopolitical events. Metals such as gold and silver often act as safe havens during uncertainty. Agricultural commodities are affected by weather, seasons, and global demand.
5. Bonds and Interest Rate Trends
Bond markets are closely tied to interest rates and the economic outlook. Government bonds and yield curves reflect investor expectations about growth and inflation. Rising interest rates can pressure markets, while falling rates often support economic expansion and asset price growth.
6. ETFs and Sector Trends
ETFs allow traders to follow trends across specific sectors or markets. Sector rotation strategies involve shifting investments between industries based on economic cycles. High-growth ETFs focus on sectors like technology or innovation, offering opportunities during strong market expansions.
Role of Economic Data in Trending Markets
Economic data drives trending markets through key factors like economic calendars, news releases, inflation, and interest rates. These elements influence market sentiment and price direction. Positive sentiment supports trends, while uncertainty can reverse them. Traders use this data to anticipate movements, manage risk, and align with prevailing market trends effectively.
1. Economic Calendar and News Impact
The economic calendar is a key tool for traders, as it highlights scheduled events such as interest rate decisions, employment reports, and GDP releases. These events often trigger strong price movements and can either strengthen or reverse existing trends. High-impact news increases volatility, making it essential for traders to anticipate and react to market changes effectively.
2. Inflation and Interest Rates
Inflation and interest rates play a central role in shaping market trends. Rising inflation often leads central banks to increase interest rates, which can slow economic growth and impact asset prices. Higher interest rates may strengthen a currency but weaken stocks and commodities. Conversely, lower rates tend to support risk assets and encourage upward market trends.
3. Global Market Sentiment
Global market sentiment reflects the overall mood and confidence of investors. Positive sentiment, driven by strong economic data or stability, supports bullish trends. Negative sentiment, often caused by uncertainty or geopolitical risks, leads to bearish movements. Understanding sentiment helps traders align with market direction and anticipate potential trend shifts.
Strategies for trading in trending markets
trading in trending markets focuses on capturing sustained price movement in one direction. Instead of predicting reversals, traders aim to follow the trend and profit from its continuation.
1. Trend Following Strategy
The trend following strategy focuses on trading in the same direction as the market. Instead of predicting reversals, traders identify a clear uptrend or downtrend and align their positions accordingly. This approach increases the probability of success by following the dominant market force and avoiding unnecessary counter-trend risks.
2. Trading with the Market Direction
Trading with the market direction means entering positions that match the current trend. In an uptrend, traders look for buying opportunities, while in a downtrend, they focus on selling. This strategy helps reduce risk, improves timing, and allows traders to benefit from sustained price movements rather than short-term fluctuations.
3. Breakout Strategy
The breakout strategy involves entering trades when price moves beyond key support or resistance levels. Breakouts often signal the start or continuation of a strong trend. Traders monitor consolidation zones and enter once price breaks out with momentum, aiming to capture early moves in a developing trend.
4. Entering Strong Trends Early
Entering strong trends early requires patience and confirmation. Traders look for signs such as increasing volume, strong price momentum, and clear breakouts. Early entries provide better risk-to-reward ratios and allow traders to maximize profits as the trend develops over time.
5. Pullback Strategy
The pullback strategy focuses on entering trades after temporary corrections within a trend. Instead of chasing price, traders wait for the market to retrace to key levels such as support, trendlines, or moving averages before entering in the direction of the trend.
6. Buying Dips in Uptrends
In an uptrend, buying dips means entering when price temporarily declines to support levels. This provides a better entry price and lower risk. As long as the trend remains intact, these pullbacks often lead to continued upward movement.
7. Selling Rallies in Downtrends
In a downtrend, selling rallies involves entering short positions when price temporarily rises to resistance levels. These rallies are often short-lived, and the trend usually resumes downward, giving traders an opportunity to profit from continued bearish momentum.
Risk Management in Trending Markets
Effective risk management is essential when trading in trending markets, as even strong trends can reverse unexpectedly. Proper control of risk helps protect capital and ensures long-term consistency.
1. Setting Stop Loss Correctly
- Place stop-loss orders based on market structure, not random distances.
- In an uptrend, set the stop loss below the most recent swing low to protect against trend failure.
- In a downtrend, place it above the most recent swing high.
- Avoid placing stops too tight, as normal market fluctuations may trigger them.
- Adjust stop-loss levels as the trend progresses to lock in profits (trailing stop).
2. Position Sizing
- Determine position size based on your total account balance and risk tolerance.
- Risk only a small percentage of your capital per trade (commonly 1–2%).
- Larger positions can be used in strong, confirmed trends, while smaller positions are الأفضل in uncertain conditions.
- Always calculate position size before entering a trade to maintain consistency.
- Proper position sizing helps prevent large losses from a single trade.
3. Avoiding Overtrading
- Do not enter multiple trades without clear setups or confirmations.
- Focus on high-quality opportunities instead of trading every market movement.
- Overtrading often leads to emotional decisions and increased risk exposure.
- Stick to a clear trading plan and avoid impulsive entries.
- Give trades time to develop instead of constantly opening and closing positions.
By applying these principles, traders can manage risk effectively, protect their capital, and take advantage of trending markets with greater discipline and confidence.
Common Mistakes in Trending Markets
trading in trending markets can be highly profitable, but many traders fail due to avoidable mistakes. Understanding these errors helps improve consistency and decision-making.
1. Trading Against the Trend
- One of the most common mistakes is trying to predict reversals too early.
- Traders open positions opposite to the main trend, expecting a quick change in direction.
- Strong trends often continue longer than expected, leading to repeated losses.
- Counter-trend trading increases risk because it goes against market momentum.
- It is safer to align trades with the dominant trend instead of fighting it.
2. Entering Too Late
- Many traders enter the market after the trend is already mature.
- Late entries often result in poor risk-to-reward ratios.
- Price may be near exhaustion, increasing the chance of reversal.
- Emotional decisions like fear of missing out (FOMO) lead to late trades.
- Early planning and patience are essential to avoid chasing price.
3. Ignoring Confirmations
- Entering trades without confirmation signals increases failure rate.
- Confirmation can include breakouts, volume increase, or trend structure validation.
- Skipping confirmation often leads to false entries and unnecessary losses.
- Traders should wait for clear signals before entering positions.
- Confirmation improves accuracy and reduces uncertainty in decision-making.
4. Misreading Market Conditions
- Traders often confuse ranging markets with trending markets.
- Entering trend strategies in sideways markets leads to weak performance.
- Misidentifying structure results in poor trade selection.
- Market context is essential before applying any strategy.
- Proper analysis of trend, range, or reversal conditions improves trading efficiency.
By avoiding these common mistakes, traders can significantly improve performance and take better advantage of trending market opportunities.
Pro Tips for trading in trending markets
Successful trading in trending markets requires more than just identifying direction. It involves combining tools, analysis techniques, and discipline to improve decision-making.
1. Combine Multiple Indicators
- Use more than one indicator to confirm trend direction.
- Combine tools like moving averages, RSI, and trendlines for stronger signals.
- Avoid relying on a single indicator, as it may give false signals.
- Confirmation from multiple sources increases trading accuracy.
- The goal is to build a complete picture of market behavior.
2. Use Multi-Timeframe Analysis
- Analyze the market on different timeframes (e.g., daily, 4-hour, 1-hour).
- Higher timeframes show the main trend direction.
- Lower timeframes help refine entry and exit points.
- Aligning timeframes improves timing and reduces risk.
- This approach helps avoid trading against the larger trend.
3. Focus on High-Probability Setups
- Only take trades that clearly match the trend structure.
- Look for strong confirmation signals such as breakouts or pullbacks.
- Avoid low-quality or unclear market conditions.
- Patience is key to waiting for the best opportunities.
- Fewer but higher-quality trades lead to better long-term results.
4. Stay Updated with Global Markets
- Monitor economic news and global financial events regularly.
- Central bank decisions, inflation data, and geopolitical events affect trends.
- Market sentiment can change quickly based on global developments.
- Staying informed helps anticipate volatility and trend shifts.
- Awareness of macro factors improves overall trading strategy.
When Trending Markets Become Risky
Trending markets can offer strong opportunities, but they also become risky in certain conditions. Understanding these situations helps traders avoid unnecessary losses and protect capital.
1. During Major News Events
- High-impact news such as interest rate decisions, inflation reports, or employment data can disrupt existing trends.
- Price may move violently in both directions within seconds, causing unpredictable volatility.
- Stop losses can be triggered easily due to sharp spikes and slippage.
- Trends that looked stable may suddenly reverse after news releases.
- Traders often reduce exposure or stay out of the market during major announcements.
2. Low Liquidity Periods
- Low liquidity occurs when fewer market participants are active, such as during holidays or off-market hours.
- In these conditions, price movements can become erratic and less reliable.
- Spreads may widen, increasing trading costs and reducing profitability.
- Trends may appear weak or inconsistent due to lack of volume.
- It is safer to avoid trading or reduce position size during low liquidity periods.
3. False Breakouts
- A false breakout happens when price moves beyond support or resistance but quickly reverses back.
- Traders may enter too early, expecting a strong trend continuation that does not occur.
- These moves often trap traders and lead to sudden losses.
- Lack of volume confirmation is a common reason for false breakouts.
- Waiting for confirmation and retests helps reduce the risk of being caught in fake moves.
Maximize Opportunities in Trending Markets with Evest
In trending markets, timing and precision are everything and that’s where Evest stands out. The platform equips traders with advanced charting tools, real-time data, and powerful indicators to help identify and follow strong market trends with confidence. Whether the market is in a strong uptrend or a sharp downtrend, Evest allows you to react quickly, manage risk effectively, and capitalize on momentum. With its intuitive interface and professional trading environment, Evest helps you stay aligned with market direction and make more informed, strategic trading decisions.
FAQS :
What are trending markets?
Trending markets are markets where price moves consistently in one direction, either upward or downward, over a period of time. These trends reflect strong dominance of buyers or sellers. Identifying trending markets helps traders follow momentum, avoid noise, and focus on high-probability opportunities aligned with the overall market direction.
How can you identify a trending market?
A trending market can be identified by observing higher highs and higher lows in an uptrend, or lower highs and lower lows in a downtrend. Traders also use tools like moving averages and trendlines. Strong momentum and consistent price movement in one direction are key signals of a trending environment.
Why are trending markets important for traders?
Trending markets are important because they provide clearer trading opportunities compared to sideways markets. When a trend is strong, traders can follow the direction of price with higher probability of success. Trends reduce uncertainty, improve timing, and allow traders to ride sustained movements instead of reacting to random fluctuations.
What strategies work best in trending markets?
Trend-following strategies work best in trending markets. These include buying pullbacks in an uptrend and selling rallies in a downtrend. Breakout strategies are also effective when price continues in the same direction. Combining trend analysis with risk management helps traders maximize profits while controlling potential losses effectively.
What are the risks of trading in trending markets?
Although trending markets offer opportunities, they also carry risks such as sudden reversals or false breakouts. Entering too late or ignoring confirmation signals can lead to losses. Traders must manage risk carefully, use stop-loss orders, and avoid overconfidence, especially when trends appear strong but may be nearing exhaustion.
How does momentum affect trending markets?
Momentum measures the strength and speed of price movement in a trend. Strong momentum supports continuation, while weak momentum may signal a slowdown or reversal. Traders use momentum to confirm trend strength and decide whether to enter, hold, or exit trades, making it a key component in trending market analysis.
What is the Relative Strength Index Indicator in trading?
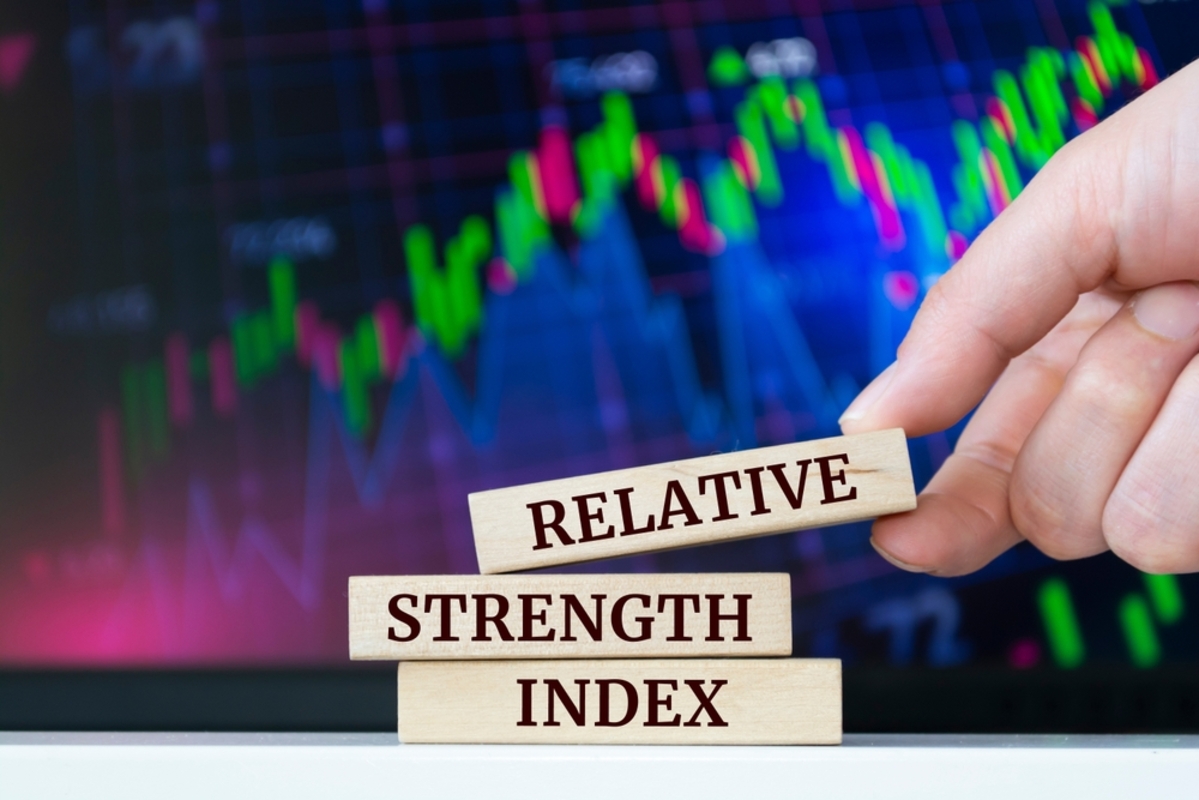
The Relative Strength Index Indicator (RSI) is a widely used momentum indicator in technical analysis that helps traders evaluate the speed and magnitude of price movements. Developed by J. Welles Wilder, the RSI measures whether an asset is overbought or oversold on a scale from 0 to 100. Typically, readings above 70 indicate overbought conditions, while readings below 30 suggest oversold levels.
By analyzing these signals, traders can identify potential trend reversals, confirm market strength, and improve entry and exit decisions. The RSI is especially effective when combined with other indicators and market structure analysis to enhance trading accuracy and reduce risk.
Why is RSI one of the most popular momentum indicators?
The relative strength index meaning has earned its place as a cornerstone in technical analysis due to its simplicity and effectiveness. Traders across all experience levels rely on it because it provides clear insights into market momentum, overbought, and oversold conditions. Unlike complex indicators that require advanced knowledge, the RSI offers actionable signals with minimal setup, making it ideal for both beginners and seasoned professionals. Its ability to function across different markets—stocks, forex, cryptocurrencies, and commodities—adds to its universal appeal. Traders on Evest use RSI to refine their strategies to refine their strategies, reduce emotional decision-making, and improve trade accuracy. Whether you’re analyzing short-term swings or long-term trends, the RSI’s versatility ensures it remains relevant in any trading environment.
Why Is the RSI So Powerful?
What makes the RSI particularly powerful is its dual functionality: it serves as both a momentum oscillator and a divergence tool. This means traders can use it not only to identify potential reversals but also to confirm trend strength or weakness. The indicator’s scalability—working effectively on 1-minute charts for day traders and weekly charts for swing traders—further solidifies its status as a go-to tool. However, its popularity doesn’t mean it is foolproof. Like all technical indicators, the RSI requires proper understanding and context to avoid common pitfalls such as false signals in strong trends or prolonged overbought/oversold conditions.
How traders use RSI to improve decision-making?
In practice, traders rely on the Relative Strength Index Indicator (RSI) not just as a standalone indicator, but as a strategic tool to enhance decision-making, improve discipline, and refine overall trading performance. By integrating RSI into their analysis, they can better manage emotions, control risk, and identify optimal entry and exit points with greater confidence.
- Reducing over-trading: The RSI helps traders avoid impulsive decisions by providing objective signals rather than relying on gut feelings. For example, a trader might hesitate to enter a long position when the RSI is already in overbought territory (above 70), even if the price appears attractive. This disciplined approach helps filter out weak setups and focuses only on high-probability trades.
- Improving Risk Management: By identifying overbought or oversold conditions, traders can set tighter stop-loss levels or take partial profits before a potential reversal. For instance, if an asset’s RSI hits 80 in an uptrend, a trader might consider reducing position size or exiting entirely, knowing the risk of a pullback increases. At Evest, the RSI is emphasized as a confirmation tool when combined with other indicators like moving averages or volume analysis.
- Enhancing Entry and Exit Timing: Instead of guessing when a trend might reverse, traders can wait for the RSI to exit overbought or oversold zones before initiating trades. This method reduces the likelihood of chasing price movements and improves trade precision.
- Using Divergence as an Early Signal: The RSI’s divergence feature—where price makes a new high or low while the RSI fails to confirm—serves as an early warning for potential trend changes. This is particularly useful in ranging markets where assets move between support and resistance levels without clear direction.
What Is the Relative Strength Index Indicator (RSI)?
The Relative Strength Index (RSI) is a momentum oscillator that measures the speed and change of price movements. Developed by J. Welles Wilder in 1978, it oscillates between 0 and 100, providing traders with a visual representation of an asset’s momentum. Unlike trend-following indicators, the RSI is designed to highlight overbought or oversold conditions, which can signal potential reversals. Its simplicity lies in its binary output: values above 70 typically indicate overbought conditions, while values below 30 suggest oversold conditions. This straightforward interpretation makes it accessible for traders of all levels, including those new to relative strength index technical analysis.
What RSI Actually Measures?
At its core, the RSI measures the magnitude of recent price changes to determine whether an asset is overvalued or undervalued relative to its recent trading range. It does this by comparing average gains to average losses over a specified period (usually 14 periods). If the average gains are significantly higher than the losses, the RSI will rise toward 100, indicating overbought conditions. Conversely, if losses dominate, the RSI will drop toward 0, signaling oversold conditions. This dynamic range helps traders gauge whether an asset is due for a pullback or a continuation of the current trend.
RSI Scale Explained (0–100)
The RSI scale is divided into three primary zones:
- Overbought Zone (70–100): Suggests the asset may be due for a pullback or reversal.
- Oversold Zone (0–30): Indicates the asset may be oversold and due for a bounce.
- Neutral Zone (30–70): Represents a balanced market where momentum is neither extreme nor weak.
While these zones are widely used, it is important to note that the RSI can remain in overbought or oversold territory for extended periods during strong trends. This is why traders often combine the RSI with other tools to avoid false signals.
How RSI Works?
Momentum in trading refers to the rate of acceleration of price movements. Strong momentum indicates that an asset is moving quickly in one direction, while weak momentum suggests consolidation, stagnation, or a potential reversal. The RSI quantifies this momentum by comparing recent gains to recent losses over a defined period, typically 14 periods.
For example, if an asset closes higher in most of the last 14 periods, the RSI will reflect strong upward momentum, pushing the value toward 70 or above. Conversely, if losses dominate, the RSI will decline toward 30 or below. This momentum-based calculation allows traders to estimate whether a trend is strengthening or losing force, helping them anticipate potential continuations or reversals.
RSI Behavior in Different Market Conditions
The RSI does not behave the same way in all market environments. Its interpretation depends heavily on overall price structure:
- Trending Markets: In strong uptrends, the RSI may remain above 70 for extended periods without signaling an immediate reversal. Similarly, in strong downtrends, it can stay below 30. In these conditions, treating overbought or oversold levels as automatic reversal signals can lead to premature entries.
- Ranging Markets: The RSI is most effective in sideways or consolidating markets. In these environments, it typically oscillates between overbought and oversold zones, creating clearer opportunities for buying near support and selling near resistance.
- Volatile Markets: During periods of high volatility, RSI readings can become erratic and generate false signals. Because of this, traders often rely on additional confirmation tools such as trendlines, support and resistance levels, or volume-based indicators.
RSI Formula and Calculation
The Relative Strength Index calculation is based on a two-step process that measures the relationship between average gains and average losses over a selected period.
Calculate Average Gain and Average Loss
For each period:
- Subtract the previous closing price from the current closing price.
- If the result is positive, it is recorded as a gain.
- If the result is negative, it is recorded as a loss.
- Gains and losses are then averaged over a defined lookback period (commonly 14 periods).
Compute Relative Strength (RS) and RSI
Once averages are calculated:
- Relative Strength (RS):
RS = Average Gain ÷ Average Loss - RSI Formula:
RSI = 100 − (100 ÷ (1 + RS))
This formula reduces the impact of short-term price fluctuations, revealing the underlying momentum trend.
Understanding Gains vs Losses
The RSI focuses on the frequency and consistency of gains and losses rather than the size of individual price moves. This means:
- A small gain is treated the same as any other gain within the period.
- A small loss is treated the same as any other loss.
As a result, the RSI filters out extreme price spikes and provides a more stable view of overall market direction.
How to Read the RSI Indicator?
Understanding how to read the RSI indicator is a key step in applying it effectively within any trading strategy. While RSI values are straightforward numerically, their interpretation depends on market context.
Traders typically focus on:
- Overbought levels (above 70): Potential exhaustion of buying pressure.
- Oversold levels (below 30): Potential exhaustion of selling pressure.
- Neutral zone (30–70): Market consolidation or balanced momentum.
However, RSI should not be used in isolation. Effective interpretation requires combining RSI signals with price action, trend structure, and other technical tools to reduce false signals and improve decision-making accuracy.
Key Considerations When RSI Is Overbought
- Trend Confirmation: If the market is in a strong uptrend (higher highs and higher lows), an RSI above 70 may reflect sustained momentum rather than exhaustion.
- Volume Analysis: Rising volume alongside an overbought RSI often confirms bullish strength, Declining volume may indicate weakening momentum and possible exhaustion.
- Support and Resistance Levels: An overbought RSI near a major resistance zone (such as previous highs) increases the probability of a reversal. In trending markets, however, it may simply signal a temporary pause.
- Moving Average Alignment: If price remains above a key long-term moveing average (such as the 200-day MA), overbought RSI readings are less likely to result in immediate reversals.
Common Scenarios Where RSI Stays Overbought
- Strong Bullish Trends: Assets like Bitcoin or high-growth equities (e.g., Tesla) can remain above 70 for long periods during powerful uptrends.
- Breakout Moves: Sharp breakouts often push RSI into overbought territory before consolidation occurs.
- News-Driven Rallies: Positive earnings or macroeconomic news can sustain elevated RSI levels temporarily.
- Liquidity Surges: Events such as central bank announcements may trigger strong buying pressure that keeps RSI elevated.
Key Considerations When RSI Is Oversold
- Trend Context: In a confirmed downtrend, oversold RSI levels may indicate temporary relief rallies rather than full reversals.
- Support Levels: If RSI reaches oversold territory near strong support zones (such as historical lows or Fibonacci retracements), the probability of a bounce increases.
- Volume Behavior
- Declining volume during oversold conditions may suggest selling exhaustion.
- Increasing volume may indicate continued bearish strength or panic selling.
- RSI Divergence: A bullish divergence occurs when price makes lower lows while RSI forms higher lows. This is often a strong early signal of a potential reversal.
Common Scenarios Where RSI Stays Oversold
- Strong Bearish Trends: During extended downtrends, many stocks and crypto assets remain below 30 for long periods.
- Market Crashes: Events like the 2008 financial crisis or COVID-19 selloff in 2020 often push RSI to extreme oversold levels.
- Assets with high short interest may show oversold RSI readings before sharp upward reversals.
- During liquidity crises, thin markets or panic selling can keep RSI suppressed for extended periods before a sudden rebound
Neutral Zone and Trend Strength
The neutral zone (30–70) is where the RSI spends most of its time in balanced or non-extreme market conditions. In this range, the indicator does not signal overbought or oversold conditions, but instead reflects moderate and developing momentum.
Rather than generating direct buy or sell signals, the neutral zone is mainly used to understand trend behavior and strength.
How Traders Use the Neutral Zone?
- Identify Trend Continuation: If the price is trending upward and the RSI is gradually rising within the neutral zone, it confirms sustained bullish momentum.
- Spot Weakening Trends: If the RSI starts to decline while price is still in an uptrend, it may indicate weakening momentum and a potential reversal ahead.
- Avoid over-trading: Since RSI is not in extreme territory, traders often avoid aggressive entries and wait for clearer confirmation signals.
How to Interpret RSI in the Neutral Zone?
- Uptrend + Rising RSI: Confirms strong bullish momentum; potential long opportunities.
- Uptrend + Falling RSI: Signals weakening momentum; consider taking profits or tightening stops.
- Downtrend + Falling RSI: Confirms strong bearish momentum; potential short opportunities.
- Downtrend + Rising RSI: Signals weakening bearish momentum; possible exit or reversal setup.
RSI Trading Strategies
RSI trading strategies help transform the indicator from a simple momentum oscillator into a structured decision-making tool. By applying RSI in different market conditions—such as overbought/oversold zones, divergence setups, and trending or ranging markets—traders can improve timing and reduce emotional decision-making.
Overbought & Oversold Strategy
Overbought Conditions (Above 70)
An RSI above 70 indicates strong buying pressure and suggests that the asset may be extended to the upside. However, it does not guarantee an immediate reversal, especially in strong uptrends where momentum can persist.
Oversold Conditions (Below 30)
An RSI below 30 indicates strong selling pressure and suggests that the asset may be undervalued in the short term. Like overbought conditions, it does not guarantee an immediate bounce, especially in strong downtrends.
When NOT to Trade These Signals
Traders should avoid relying solely on overbought or oversold signals during strong trending markets. In such conditions:
- Price can continue in the same direction despite extreme RSI levels.
- Premature entries often lead to losses.
Key Principle
RSI overbought/oversold signals are most effective when combined with:
- Price action confirmation
- Trend context
- Additional technical indicators
This combination significantly improves the accuracy of trading decisions.
RSI Divergence Strategy
Bullish Divergence
Bullish divergence occurs when price forms a lower low, while the RSI forms a higher low. This indicates that selling pressure is weakening even though price continues to decline, suggesting a potential upward reversal.
Bearish Divergence
Bearish divergence occurs when price forms a higher high, while the RSI forms a lower high. This signals that buying momentum is fading despite rising prices, increasing the likelihood of a downward reversal.
How to Confirm Reversals
Divergence signals are more reliable when confirmed with additional tools, such as:
- Candlestick reversal patterns (e.g., engulfing, hammer, shooting star)
- Key support and resistance levels
- Volume confirmation (increasing volume on reversal strengthens the signal)
Using multiple confirmations reduces the risk of acting on false divergence signals.
RSI Trend Strategy
Using RSI in Trending Markets
In strong uptrends, RSI often remains above 50 and may frequently enter overbought territory. In strong downtrends, it tends to stay below 50 and may repeatedly enter oversold zones.
Instead of predicting reversals, traders use RSI here to confirm trend direction and strength.
RSI in Ranging Markets
In sideways or consolidating markets, RSI typically oscillates more predictably between 30 and 70.
This makes overbought and oversold readings more effective for identifying short-term trading opportunities, especially near support and resistance levels.
relative strength index strategy
Entry and Exit Signals
Swing traders often use RSI to improve timing:
- Entries: Near oversold levels during an uptrend
- Exits: Near overbought levels or when momentum begins to fade
For best results, RSI signals are usually combined with price action confirmation and broader trend analysis.
Best Timeframes for Swing Trading
The most commonly used timeframes for RSI-based swing trading are:
- 4-hour charts
- Daily charts
These timeframes provide a balance between signal reliability and sufficient trading opportunities, reducing market noise compared to lower timeframes.
Trade Smarter Using the RSI Indicator on Evest
Trading smarter isn’t about increasing effort or the number of trades—it’s about making informed decisions using the right tools. One of the most effective indicators for this purpose is the Relative Strength Index (RSI). When applied through a reliable platform like Evest, RSI becomes a powerful tool that helps traders identify opportunities with greater accuracy and confidence.
- Understanding RSI: The RSI measures market momentum and indicates whether an asset is overbought or oversold, helping traders rely on data instead of emotions.
- Versatility Across Markets: On Evest, RSI can be applied to multiple markets including forex, commodities, stocks, and cryptocurrencies.
- Combining RSI with Other Tools: Traders can enhance accuracy by using RSI alongside price action, support and resistance levels, and volume analysis to reduce false signals.
- Identifying Trends and Reversals: RSI is effective in spotting potential reversals and assessing trend strength, especially when used within a structured strategy.
- Building a Smarter Trading Approach: Success with RSI comes from discipline—combining strategy, analysis, and the right tools to improve consistency and long-term performance.
FAQs
What is the RSI indicator and why is it used in trading?
The RSI (Relative Strength Index) is a technical indicator that measures momentum on a scale from 0 to 100. Traders use it to identify overbought and oversold conditions. Above 70 suggests overbought, below 30 suggests oversold. It helps anticipate potential reversals and improve timing for entries and exits.
Is RSI enough on its own to make trading decisions?
No, RSI should not be used alone because it can produce false signals, especially in strong trends or volatile markets. It is best combined with price action, support and resistance levels, and volume analysis. Using multiple confirmations improves accuracy and reduces the risk of bad trading decisions.
What is the difference between overbought and oversold in RSI?
Overbought occurs when RSI rises above 70, indicating strong buying pressure that may slow down. Oversold occurs when RSI falls below 30, indicating strong selling pressure that may lead to a bounce. However, these conditions do not guarantee immediate reversals, especially in strong trending markets.
What is RSI divergence and why is it important?
RSI divergence happens when price and RSI move in opposite directions. For example, price makes higher highs while RSI makes lower highs. This signals weakening momentum and a possible reversal. It is one of the strongest RSI signals but should still be confirmed with other technical tools.
How does RSI help in trending markets?
In uptrends, RSI often stays above 50 and may frequently enter overbought territory. In downtrends, it usually stays below 50. Instead of predicting reversals, traders use RSI to confirm trend strength and stay aligned with the dominant market direction.
What are the best timeframes to use RSI?
RSI works on all timeframes, but effectiveness depends on trading style. Day traders use lower timeframes like 1-hour or less, while swing traders prefer 4-hour and daily charts. Higher timeframes provide more reliable signals and reduce market noise.
What are Bollinger Bands in Trading?

Bollinger Bands In Trading are one of the most widely used technical analysis tools, designed to measure market volatility and identify potential overbought or oversold conditions. They consist of three lines: a middle moving average and two outer bands that expand and contract based on price volatility.
When the market becomes more volatile, the bands widen, and when volatility decreases, they contract. Traders use Bollinger Bands to spot potential entry and exit points, as well as to understand whether the price is relatively high or low compared to recent market behavior. However, they work best when combined with other indicators and confirmation tools to avoid false signals and improve trading accuracy in different market conditions.
What Are Bollinger Bands In Trading?
Bollinger Bands are a technical analysis tool consisting of three lines: a simple moving average (SMA) in the center, flanked by an upper and lower band. These bands are plotted at a standard deviation distance from the SMA, creating a channel that encapsulates price action. The indicator’s primary purpose is to measure volatility and identify potential overbought or oversold conditions. Unlike fixed channels, Bollinger Bands adjust dynamically to market conditions, making them adaptable to various trading styles and timeframes.
Components of the Indicator
- Middle Band (SMA): The foundation of the indicator, calculated as the average price over a specified period (typically 20 periods). This band acts as the baseline for volatility measurement.
- 2. Upper Band: Plotted two standard deviations above the SMA. It represents the upper boundary of price action, signaling potential resistance levels.
- 3. Lower Band: Plotted two standard deviations below the SMA. It acts as support, indicating potential buying opportunities when the price approaches it.
The Concept Behind the Indicator
The genius of Bollinger Bands In Trading lies in their statistical foundation. Standard deviation measures how much prices deviate from the mean (SMA), providing a probabilistic view of price behavior. For example:
- If price touches the upper band, it suggests the asset is overbought, and a pullback may be imminent.
- If price touches the lower band, it may indicate oversold conditions, setting up a potential rebound.
This concept aligns with the principle of mean reversion, where prices tend to revert to their average over time. However, Bollinger Bands also account for volatility shifts, making them more robust than static tools like fixed channels. For traders, this adaptability is a game-changer, as it allows for real-time adjustments to changing market conditions.
Why Bollinger Bands Are Essential in Technical Analysis?
Technical analysis relies on indicators that help traders visualize market behavior, predict price movements, and make informed decisions. Among these tools, Bollinger Bands In Trading stand out as one of the most versatile and widely used indicators.
Developed by John Bollinger in the 1980s, this indicator provides a dynamic framework for assessing market volatility, identifying overbought or oversold conditions, and spotting potential trend reversals.
Key Reasons Why Bollinger Bands Are Important
- They measure market volatility dynamically instead of using fixed levels.
- They help identify overbought and oversold market conditions.
- They assist in spotting potential breakouts and trend reversals.
- They work effectively in both trending and ranging markets.
- They can be combined with other indicators for higher accuracy.
- They are suitable for multiple asset classes, including forex, stocks, and crypto.
How They Help Traders Understand Market Volatility?
Volatility is the heartbeat of financial markets—it dictates the speed and intensity of price movements. Bollinger Bands act as a volatility gauge, visually representing how much the price deviates from its average over a set period.
- The wider the bands → higher the volatility
- The narrower the bands → lower the volatility.
This dynamic relationship allows traders to anticipate different market phases:
High Volatility Phases
When bands expand, traders should prepare for:
- Sharp price swings
- Potential breakouts
- Possible false signals in strong trends
Low Volatility Phases
When bands contract (narrow):
- The market is in a consolidation or sideways movement.
- Prices are range-bound
- Ideal conditions for mean reversion strategies
Volatility Expansion
A sudden widening of the bands often signals:
- A potential upcoming breakout
- An early warning for traders to adjust positions
How Bollinger Bands Are Calculated?
The calculation of Bollinger Bands involves three key steps:
1. Calculate the Simple Moving Average (SMA)
This is the average price over a set number of periods (e.g., 20 periods).
SMA=Sum of closing prices over N periodsNSMA = \frac{\text{Sum of closing prices over } N \text{ periods}}{N}SMA=NSum of closing prices over N periods
2. Determine the Standard Deviation (SD)
This measures the dispersion of prices from the SMA.
SD=∑(Pi−SMA)2NSD = \sqrt{\frac{\sum (P_i – SMA)^2}{N}}SD=N∑(Pi−SMA)2
- Plot the Bands
- Upper Band = SMA + (2 × SD)
- Lower Band = SMA − (2 × SD)
The Role of the Simple Moving Average (SMA)
The SMA serves as the anchor for Bollinger Bands In Trading, providing a smooth representation of the trend. Unlike exponential moving averages (EMAs), which give more weight to recent prices, the SMA offers a balanced view of price action over the selected period. This makes it ideal for identifying the midpoint of volatility, around which the bands expand and contract. For traders focusing on Bollinger Band stocks, the SMA helps distinguish between short-term noise and meaningful trend shifts.
Understanding Standard Deviation
Standard deviation is the engine behind Bollinger Bands’ volatility measurement. It quantifies how much prices deviate from the SMA, with higher values indicating greater volatility. For example:
In a high volatility market, the bands will widen, reflecting larger price swings.
In a low volatility market, the bands will narrow, suggesting a consolidation phase.
This dynamic adjustment is whyBollinger Bands are superior to fixed channels—they evolve with the market. Traders can use the Bollinger Bands width indicator to gauge whether volatility is increasing or decreasing, which is critical for timing entries and exits.
How Do Bollinger Bands Work?
Bollinger Bands work by dynamically adjusting to market volatility and helping traders understand how the price behaves relative to its recent average. The indicator is built around a moving average, with upper and lower bands that expand and contract based on price fluctuations.
Volatility and Price Behavior
The relationship between volatility and price behavior is at the core of Bollinger Bands’ functionality. When volatility is high, the bands widen, creating more space for the price to move between support and resistance levels. This often precedes breakouts or sharp reversals. Conversely, when volatility is low, the bands contract, indicating a period of consolidation where prices are rangebound.
Traders can use this information to:
- Identify Overbought/Oversold Conditions: Price near the upper band may signal resistance, while price near the lower band may indicate support.
- Spot Volatility Expansions: A sudden widening of bands can precede a Bollinger Bands breakout, offering early entry opportunities.
- Avoid False Signals: In strong trends, the price may stay outside the bands for extended periods, requiring additional confirmation.
Band Expansion and Contraction
The expansion and contraction of Bollinger Bands provide critical insights:
- Expanding Bands: Signal increasing volatility, often leading to breakouts or sharp price movements. Traders should watch for Bollinger bands entry and exit signals near the bands.
- Contracting Bands: Indicate low volatility and potential consolidation. This phase is ideal for mean reversion strategies, where traders buy near the lower band and sell near the upper band.
What Happens When Price Touches the Bands?
Price interactions with the bands are not random—they reflect underlying market psychology:
- Price Touches the Upper Band: Often signals overbought conditions, suggesting a potential pullback. However, in strong uptrends, the price may stay above the band, requiring trend confirmation.
- Price Touches the Lower Band: May indicate oversold conditions, setting up a potential rebound. Again, in strong downtrends, the price may remain below the band.
- Price Stays Within Bands: Suggests consolidation or a balanced market, where traders may look for breakout signals.
Understanding these interactions is key to bollinger bands how to trade effectively. For instance, combining band touches with volume spikes can filter out false signals, improving trade accuracy.
How to Read Bollinger Bands Correctly?
Reading Bollinger Bands correctly requires understanding that price interactions with the bands should always be interpreted within the broader market context rather than as standalone signals. The bands reflect volatility and relative price extremes, so their meaning changes depending on whether the market is trending, consolidating, or breaking out.
Price Touching the Upper Band
When the price touches the upper band, it doesn’t always mean a reversal is imminent. The context matters:
- In an Uptrend: Price may repeatedly touch the upper band before continuing higher. Traders should wait for a pullback or bearish candlestick patterns for confirmation.
- In a Downtrend: A touch of the upper band could signal Price Touching the Upper Band.
When the price touches the upperBollinger Band, traders must interpret this signal within the broader market context to avoid false reversals. Here’s how to analyze it effectively:
- Overbought Condition: A touch of the upper band often suggests the asset is technically overbought, meaning a pullback or reversal could occur. However, this is not guaranteed, especially in strong trending markets.
- Trend Confirmation Needed: In an uptrend, price may repeatedly test the upper band before continuing higher. Traders should look for:
Bearish candlestick patterns (e.g., shooting star, evening star) near the band.
Volume decline on the touch, indicating weakening momentum.
Moving average (e.g., 50 EMA) alignment—if price is above the MA, the uptrend is likely intact.
- Breakout Potential: If price closes above the upper band with strong volume, it may signal a breakout. Traders should then watch for further confirmation, such as a close beyond the next resistance level.
- False Signals in Strong Trends: During strong uptrends, the price may stay above the upper band for extended periods. Traders relying solely on band touches risk entering late or getting whipsawed.
Price Touching the Lower Band
A touch of the lower Bollinger Band similarly requires careful analysis to distinguish between oversold conditions and continuation signals:
- Oversold Condition: Price near the lower band often suggests oversold conditions, setting up a potential rebound. However, this is more reliable in ranging or downtrending markets.
- Trend Context Matters:
In a downtrend, the price may repeatedly touch the lower band before continuing lower. Traders should wait for bullish candlestick patterns (e.g., hammer, morning star) or volume spikes for confirmation.
In a ranging market, a touch of the lower band may signal a buy opportunity, especially if paired with volume and bullish momentum.
- Breakout Potential: If the price closes below the lower band with strong volume, it may indicate a breakdown. Traders should then look for further confirmation, such as a close past the next support level.
- False Signals in Strong Downtrends: Just as price can stay above the upper band in uptrends, it can remain below the lower band in downtrends. Traders must avoid chasing false breakouts.
Trading Within the Bands
Trading within the bands—rather than waiting for touches—can be highly effective in ranging or low-volatility markets. Here’s how to approach it:
Mean Reversion Strategy:
Buy when price approaches the lower band (oversold conditions).
Sell when price approaches the upper band (overbought conditions).
This works best in sideways markets where price oscillates between the bands.
Key Considerations for intra-band trading:
Volatility Context: Low volatility (narrow bands) increases the reliability of mean reversion signals.
- Trend Filter: Avoid intraband trades in strong trends; instead, wait for breakouts or pullbacks aligned with the trend.
- Entry/Exit Rules:
Enter on bullish/bearish candlestick patterns near the bands.
Set stoplosses just outside the opposite band (e.g., stoploss below the lower band for long trades).
Avoiding Common Pitfalls:
Chasing Price: Don’t enter every time price touches a band—wait for confirmation.
- Ignoring Volume: Volume spikes near the bands add validity to signals.
- Overleveraging: Intraband trades can be choppy; use tight risk/reward ratios (e.g., 1:1 or 1:2).
- Bullet Points for IntraBand Trading Setup:
- Use 20-period Bollinger Bands for daily trading; adjust for shorter timeframes (e.g., 10-period for intraday).
Combine with RSI (14period) to confirm overbought/oversold conditions.
Trade only during low volatility phases (narrow bands).
Exit trades if price breaks outside the bands without confirmation.
Breakouts and Trend Signals
Bollinger Bands excel at identifying breakouts and trend shifts, especially when combined with other indicators. Here’s how to trade them:
Breakout Conditions
Price behavior beyond the bands can signal strong market moves:
- Price closes above the upper band in an uptrend → potential continuation or bullish breakout.
- Price closes below the lower band in a downtrend → potential breakdown or bearish continuation.
- Volume confirmation is essential, as breakouts should occur with above-average trading volume to filter out false signals.
Trend Continuation Signals
When the market shows strong momentum:
- If the price remains outside the bands for multiple periods, the trend is likely strong and ongoing.
- Moving averages, such as the 50 EMA, can be used to confirm the overall trend direction and strength.
False Breakouts
False signals may occur under certain conditions:
- Often appear in low-volume or highly volatile environments.
- Can be filtered using volume indicators or VWAP to reduce the risk of whipsaws
Squeeze Breakouts
When the bands contract significantly before expanding:
- This indicates a period of low volatility followed by a potential strong breakout.
- Traders typically enter positions when the price breaks the squeeze range with confirming volume.
Numbered Breakout Trading Plan
- over multiple consecutive periods depending on the timeframe used
- Wait for expansion and enter when bands widen, and price breaks the previous range.
- Confirm with volume, ensuring it is higher than the 20-day average.
- Set profit targets using Fibonacci retracements or previous swing highs and lows.
Bollinger Bands Trading Strategies
Bollinger Bands provide traders with a flexible framework to identify market opportunities based on volatility and price behavior. These strategies help interpret whether the market is trending, ranging, or preparing for a breakout. By combining Bollinger Bands with other indicators, traders can improve timing, reduce false signals, and make more informed trading decisions across different market conditions.
Mean Reversion Strategy
Mean reversion is one of the most widely used strategies with Bollinger Bands, and it works best in sideways or ranging markets where price tends to move back toward its average after deviating too far. The main idea behind this approach is that whenever price stretches toward the outer bands, it often becomes overextended and is likely to return to the middle band, which represents the moving average.
Core Principle
The core concept of this strategy is that price naturally tends to revert to its mean (SMA) after reaching extreme levels near the upper or lower bands. These extremes often reflect temporary overbought or oversold conditions rather than a permanent trend reversal.
Entry Rules
A long trade is considered when the price approaches or touches the lower band while showing signs of bullish confirmation, such as a hammer candlestick pattern or oversold conditions on RSI. On the other hand, a short trade is considered when the price nears the upper band and is supported by bearish signals like a shooting star pattern or overbought RSI readings. The goal is not to trade the band touches itself, but to wait for confirmation that momentum is starting to shift.
Exit Rules
Exits are typically planned when price moves back toward the middle band (SMA), as this represents the natural equilibrium point. In some cases, traders may hold the position longer until the price reaches the opposite band, depending on market strength. Trailing stops can also be used to protect profits while allowing the trade to develop fully.
Best Markets for Mean Reversion
This strategy performs best in stable or consolidating environments, such as major stock indices like the S&P 500 and Nasdaq, forex pairs like EUR/USD during low-volatility phases, and cryptocurrencies such as Bitcoin when the market is not trending strongly. In highly trending conditions, mean reversion becomes less reliable because the price may continue moving away from the average for extended periods.
Mean Reversion Setup Guidelines
A standard configuration uses 20-period Bollinger Bands on higher timeframes, while shorter settings like 10-period can be used for intraday trading. Combining this indicator with RSI (14-period) improves accuracy by filtering out weak signals and avoiding trades in extreme momentum conditions. It is also important to avoid using this strategy in strong trending markets, as the price may remain near the bands without reverting. Risk control is essential, and stop-loss orders are usually placed beyond the opposite band to protect against unexpected volatility spikes.
Buying Near the Lower Band
Buying near the lower band is considered a high-probability setup when executed with proper confirmation rather than blindly reacting to price touches. The first step is identifying oversold conditions, where price moves close to or touches the lower band while RSI falls below 30 and volume begins to increase, indicating potential selling exhaustion.
At this stage, traders should not enter immediately but instead wait for confirmation from price action. This often comes in the form of bullish reversal candlestick patterns such as hammer formations or bullish engulfing candles, which signal that buyers are starting to regain control.
Once confirmation appears, the trade can be executed with controlled risk. Stop-loss levels are typically placed slightly below the lower band to protect against continued downward pressure. This structured approach improves accuracy and helps traders avoid false signals during volatile market conditions.
Enhance Your Trading Strategy with Advanced Technical Tools on Evest
Trading successfully in today’s financial markets requires more than just basic knowledge—it demands precision, timing, and the right tools. That’s where Evest platform comes in, offering traders access to advanced technical analysis features designed to enhance decision-making and improve trading performance.
With powerful indicators like Bollinger Bands, traders can better understand market volatility, identify potential entry and exit points, and react more effectively to changing market conditions. Evest provides a smooth and user-friendly trading environment that allows both beginners and experienced traders to apply these tools with confidence and ease.
By combining professional-grade analysis tools with a seamless trading experience, Evest helps traders turn market insights into real opportunities, supporting smarter and more strategic trading decisions across different financial markets.
FAQs
What are Bollinger Bands used for in trading?
Bollinger Bands are used to measure market volatility and identify potential overbought or oversold conditions. They help traders understand price behavior, spot trends, and detect possible breakouts or reversals by comparing current price action to historical averages.
How do Bollinger Bands indicate market volatility?
Bollinger Bands expand when volatility increases and contract when volatility decreases. Wide bands suggest strong price movement and possible breakouts, while narrow bands indicate consolidation or low activity, helping traders anticipate upcoming market conditions more effectively.
What is the best strategy for Bollinger Bands?
One of the best strategies is mean reversion, where traders buy near the lower band and sell near the upper band in ranging markets. It works best when combined with confirmation tools like RSI or candlestick patterns.
Can Bollinger Bands predict breakouts?
Yes, Bollinger Bands can help anticipate breakouts, especially during a squeeze when the bands contract significantly. A sudden expansion with strong volume often signals that a breakout or strong trend movement is about to begin in the market.
Are Bollinger Bands enough alone for trading decisions?
No, Bollinger Bands should not be used alone. They work best when combined with other indicators such as RSI, moving averages, or volume analysis to confirm signals and reduce the risk of false breakouts or misleading price movements.
What markets work best with Bollinger Bands?
Bollinger Bands work well in forex, stock indices, and cryptocurrencies. They are especially effective in ranging or moderately volatile markets, where the price tends to move between support and resistance levels before returning to its average.
What Is stop loss and take profit?

Stop-loss and take-profit are essential risk management tools that help traders control their positions effectively. A Stop Loss is an order set at a specific price level to automatically close a trade when the market moves against the trader, limiting potential losses and protecting capital.
On the other hand, Take Profit is an order that closes a trade once a predefined profit target is reached, ensuring gains are secured without the need for constant monitoring. Together, these tools promote disciplined trading, reduce emotional decision-making, and help traders maintain a balanced risk-to-reward strategy in volatile financial markets.
What are Stop Loss and Take Profit Orders?
Understanding stop loss and take profit are fundamental for any trader looking to manage risk and secure profits in financial markets. These two order types serve as automatic safeguards, helping traders exit positions at predetermined levels without constant monitoring.
At their core, the stop-loss acts as a safety net, limiting potential losses by closing a trade when the price reaches a specified threshold. Conversely, a take-profit order locks in gains by selling an asset once it hits a target price. Together, they form the backbone of disciplined trading strategies, ensuring traders adhere to predefined risk-reward parameters rather than making emotional decisions.
Stop Loss and Take Profit Meaning
The concept of stop loss and take profit extends beyond mere technical execution. It embodies a trader’s risk management philosophy. For instance, a trader might set a stop loss 5% below their entry price to cap losses at an acceptable level, while placing a take profit 10% above to capture a reasonable profit. This dual approach balances protection with opportunity, aligning with the broader principle of a structured stop-loss and take-profit strategy. The effectiveness of these orders lies in their ability to automate decision-making, reducing the psychological strain of manual trading.
Practical Application for Traders
For beginners, grasping these concepts can feel overwhelming, but platforms like Evest offer comprehensive guides to demystify the process. Whether you’re trading stocks, forex, or cryptocurrencies, the principles remain consistent. The key is to tailor these orders to your specific trading style—whether you’re a day trader chasing quick gains or a long-term investor holding positions for months. By integrating stop loss and take profit orders into your routine, you create a structured framework that minimizes impulsive actions and fosters consistency.
How stop-loss and Take Profit Orders Work?
The mechanics of stop loss and take profit orders are straightforward yet powerful. A stop loss order is triggered when the market price reaches or exceeds the specified stop price, automatically selling the asset to limit further losses. For example, if you buy a stock at $100 and set a stop loss at $95, the order will execute if the price drops to $95, preventing losses beyond $5 per share. This mechanism is particularly valuable in volatile markets where prices can swing dramatically within minutes.
How Take Profit Orders Work?
take-profit orders, on the other hand, are designed to capitalize on gains. If you set a take-profit order at $110 for the same stock, the trade will close automatically once the price hits that level, securing your profit. The beauty of these orders lies in their precision—no need to monitor the market 24/7. Instead, you define your risk and reward parameters upfront, allowing you to focus on other aspects of your trading plan. This automation is a gamechanger for traders who juggle multiple positions or have limited time to watch the markets.
Example in Forex Trading
To illustrate, consider a forex trader who enters a long position on EUR/USD at 1.2000. They might set a stop loss at 1.1900 to protect against adverse movements and a take profit at 1.2100 to lock in a 1% gain. If the pair moves against them, the stop loss kicks in, while a favorable move triggers the take profit. This dual strategy ensures that the trader adheres to their predefined risk/reward ratio, regardless of market conditions.
Execution and Advanced Features
The execution of these orders depends on the trading platform. Most modern platforms, including those featured on Evest, allow traders to set both stop loss and take-profit levels with a few clicks. Some even offer trailing stop-loss options, which adjust dynamically as the price moves in your favor. Understanding how these orders function in real-time is crucial, as delays or slippage can sometimes occur, especially during high volatility.
How to Set stop loss and take-profit Levels?
Setting effective stop loss and take profit levels requires a blend of technical analysis, market knowledge, and personal risk tolerance. The first step is to identify key support and resistance levels on your trading chart. Support levels act as potential stop loss points, as they indicate areas where buying interest might emerge, halting further declines. Conversely, resistance levels can serve as take-profit targets, signaling potential selling pressure that could cap upward momentum.
Using Price Action Levels
For instance, if you’re trading a stock that has previously bounced off the $50 level, placing a stop loss just below this level (e.g., $49.50) could protect your position if the trend reverses. Similarly, if the stock has faced resistance at $55, setting a take profit at $54.50 allows you to exit before the price potentially reverses. This approach leverages historical price action to make informed decisions, reducing the guesswork in order placement.
Risk Management and Position Sizing
Another critical factor is position sizing. Your stop loss level should align with the amount of capital you’re willing to risk on a single trade. A common rule of thumb is to risk no more than 1–2% of your account balance on any given trade. If your account is $10,000, a 2% risk means your stop loss should be placed to limit losses to $200 or less. This disciplined approach ensures that even a string of losing trades won’t wipe out your account.
Using Technical Indicators
To further refine your strategy, consider using technical indicators like moving averages, Bollinger Bands, or Relative Strength Index (RSI). For example, a trader might set a stop loss below a 200-day moving average to avoid breaking long term trends, while using RSI to identify overbought conditions for take-profit levels. Combining these tools with your stop loss and take profit strategy can enhance the precision of your orders, making them more responsive to market dynamics.
Backtesting Your Strategy
Finally, always backtest your stop loss and take-profit levels before applying them to live trades. Historical data can reveal how your orders would have performed in past market conditions, helping you fine-tune your approach. Platforms like Evest often provide tools for backtesting, allowing you to simulate trades and optimize your parameters without risking real capital.
stop loss vs take-profit vs stop limit
While stop loss and take profit orders are essential, understanding their distinctions from stop-limit orders is equally important.
- A stop-limit order combines the features of a stop order with a limit order, offering more control over execution. When you place a stop-limit order, you set two prices:
- The stop price (which triggers the order)
- The limit price (which defines the maximum or minimum price you’re willing to accept)
Example of a stop limit Order
- A trader might set a stop-limit order to buy a stock at $100 with:
- Stop price: $95
- Limit price: $98
- If the stock drops to $95, the order becomes active, but it will only execute if the price reaches $98 or lower.
- This helps prevent the trader from paying more than their desired entry price, even if the stock moves sharply.
stop loss vs stop limit Orders
- A standard stop-loss order becomes a market order once triggered.
- This means it executes at the best available price, which may be worse than expected in fast-moving markets.
- Stop-limit orders, however, provide greater price control but come with a risk:
- The order may not execute if the market moves too quickly beyond the limit price.
take-profit Orders
- take-profit orders are typically limit orders by default.
- When you set a take-profit level:
- The trade will execute at that price or better.
- This ensures you do not sell below your target price, even if the market fluctuates slightly afterward.
Key Differences in Purpose
- Stop-loss orders → Protect against losses
- take-profit orders → Secure gains
- Stop-limit orders → Provide controlled execution with price protection
Market Application
- In highly volatile markets (like cryptocurrencies or forex):
- Traders often prefer stop-limit orders to avoid slippage during sudden price swings or news events.
- In less volatile markets (like blue-chip stocks):
- Standard stop loss and take-profit orders are often sufficient due to their simplicity and reliable execution.
Difference Between stop loss and take-profit
| Concept | Stop-Loss | Take-Profit |
| Definition | A risk management tool used to limit potential losses on a trade. | A profit-taking tool used to lock in gains when a target price is reached. |
| Main Purpose | To protect capital and prevent large losses. | To secure profits and exit trades at a predefined gain. |
| Trading Role | Defensive strategy (loss control). | Offensive strategy (profit realization). |
| Example | Buy at $100 and set stop-loss at $90 → limits loss to 10%. | Buy at $100 and set take-profit at $110 → locks 10% gain. |
| Emotional Impact | Helps reduce emotional decision-making during losses. | Helps avoid greed and ensures disciplined profit-taking. |
| Market Behavior | Activates when price moves against the trader. | Activates when price moves in favor of the trader. |
| Trader Goal | Preserve capital and reduce downside risk. | Maximize efficiency of profitable trades. |
stop-loss Order vs. Stop-Limit Order (Key Differences)
| Feature | Stop-Loss Order | Stop-Limit Order |
| Definition | An order that becomes a market order once the stop price is reached. | An order that becomes a limit order once the stop price is triggered. |
| Execution Type | Executes at the best available market price. | Executes only at the specified limit price or better. |
| Main Purpose | To exit a trade quickly and limit losses. | To control execution price and avoid slippage. |
| Slippage Risk | High risk of slippage in volatile markets. | No slippage, but higher risk of non-execution. |
| Control Level | Lower control over execution price. | Higher control over execution price. |
| Market Conditions | Works best in liquid markets with fast execution. | Works best when price stability is expected after trigger. |
| Example | Stop at $50,000 → executes at market price (may fill at $48,500 in volatility). | Stop at $50,000, limit at $49,500 → fills only if price stays within limit range. |
| Main Risk | Execution at a worse-than-expected price. | Order may not execute at all if price moves too fast. |
When to Use a stop-loss Order?
When to use a stop-loss order depends on market conditions and trading style. It is most effective in liquid markets such as stocks, ETFs, or forex pairs with high trading volume, where slippage is minimal. It is also suitable for short-term trades like day trading or scalping, where speed of execution is prioritized over precision, as well as trend following strategies where quick exit is required when the trend reverses, even if minor price deviations occur. It also works well in low-volatility environments where sharp price swings are less common.
When to Use a Stop-Limit Order?
In contrast, stop-limit orders are more suitable for illiquid markets such as cryptocurrencies, penny stocks, or thinly traded assets, where slippage can be significant. They are also useful during high volatility scenarios such as news events, earnings reports, or economic announcements where price gaps are likely. They are preferred in precision trading strategies where strict price control is required, and in situations where traders are unwilling to accept worse execution prices even if it risks the order not filling.
Practical Trading Insight
For traders using stop losses and take profits in trading, the choice between these order types can hinge on their risk tolerance and market conditions. For instance, a forex trader might use stop-limit orders during major economic releases to avoid being filled at an unfavorable rate, while a stock trader might rely on stop-loss orders for their liquidity and speed.
When to Use Each Order Type?
Deciding when to use stop-loss and take-profit orders depends on your trading style, market conditions, and risk management goals. Below are scenarios where each order type shines, along with practical examples to illustrate their application.
When to Use a stop loss Order:
1. Trending Markets:
If you’re trading in the direction of a strong trend (e.g., a bullish uptrend in stocks), a stop-loss order placed below recent swing lows can protect against sudden reversals. For example, in a stock trending upward, setting a stop loss just below the most recent pullback level ensures you exit if the trend weakens.
2. Breakout Strategies:
When trading breakouts (e.g., a stock breaking above a resistance level), a stop-loss order placed just outside the breakout point acts as a safeguard. If the breakout fails, the stop loss limits losses immediately. For instance, if a stock breaks out of a consolidation pattern at $100, placing a stop loss at $99.50 protects against a false breakout.
3. Day Trading or Scalping:
In fast-paced trading environments, stop-loss orders execute quickly, allowing traders to capitalize on short-term opportunities. For example, a day trader might set a stop loss 12% below their entry price in a highly liquid stock to manage risk while chasing intraday moves.
4. High Liquidity Assets:
Assets like major forex pairs (EUR/USD, USD/JPY) or blue-chip stocks (Apple, Microsoft) have tight bid-ask spreads, making stop-loss orders reliable. The low likelihood of slippage makes them ideal for these markets.
When to Use a Take Profit Order:
1. Target-Based Strategies:
If you’re trading based on technical levels (e.g., Fibonacci retracements, moving averages), a take-profit order ensures you exit at your predetermined target. For example, if you buy a stock at $80 and aim for a 1.618 Fibonacci extension at $95, setting a take-profit at $95 locks in your profit without emotional interference.
2. Risk-Reward Ratio Management:
A take-profit order helps enforce a disciplined risk-reward ratio. For instance, if your risk-reward target is 1:2 (risking $1 to make $2), setting a take-profit at twice the distance of your stop-loss ensures consistency. If your stop loss is at $90 for a stock bought at $100, your take profit should be at $110 to achieve the 1:2 ratio.
3. NewsDriven Trades:
When trading based on economic news (e.g., nonfarm payrolls in forex), a take-profit order can be set at a level where the market’s reaction is expected to reverse. For example, if EUR/USD spikes on positive news, a take-profit at a recent resistance level captures the move before potential profittaking sets in.
4. Swing Trading:
Swing traders holding positions for days or weeks can use take profit orders to secure gains when the market reaches key levels. For example, a trader might hold a stock for a month, setting a take-profit at a major resistance level to avoid holding through a potential reversal.
When to Use a stop limit Order:
1. Low Liquidity Markets:
In markets like cryptocurrencies or penny stocks, where slippage is common, stop-limit orders provide better price control. For example, trading a low cap altcoin with a stop limit ensures you don’t sell at a significantly worse price during a flash crash.
2. Options Trading:
When selling options, stop limit orders can protect against adverse moves while maintaining strict exit conditions. For instance, a trader selling a put option might set a stop limit to buy back the option at a specific price if the underlying asset moves against them.
3. Avoiding Gap Risks:
During earnings reports or economic data releases, markets can gap open or close. A stop limit order prevents unwanted executions at extreme prices. For example, a trader holding a stock overnight before earnings might set a stop limit to avoid a gapdown open.
4. Custom Entry/Exit Strategies:
Advanced traders using complex strategies (e.g., iron condors, straddles) often rely on stop limit orders to manage multiple legs of their trades precisely. This ensures all positions are adjusted according to predefined rules without manual intervention.
Advantages of stop loss Orders
The advantages of stop loss orders are well-documented in risk management literature, making them a cornerstone of disciplined trading. Here’s why traders rely on them:
Automated Risk Management:
stop loss orders eliminate the need for constant monitoring, reducing emotional decision-making. Once set, they execute automatically, ensuring you adhere to your risk parameters even when you’re not actively watching the market.
Loss Limitation:
The primary advantage is their ability to cap losses at a predefined level. For example, if you set a stop loss at 5% below your entry, you’re guaranteed not to lose more than that, regardless of how far the market moves against you.
Psychological Discipline:
Stop-loss orders prevent impulsive decisions, such as holding onto a losing trade in hopes of a rebound. This discipline is crucial for long-term success, as it removes the emotional bias that often leads to larger losses.
Consistency in Trading:
By using stop-loss orders across all trades, you create a consistent risk management framework. This consistency is key to developing a repeatable trading strategy, whether you’re a day trader or a long-term investor.
Protection Against Black Swan Events:
In extreme market conditions (e.g., the 2008 financial crisis, the 2020 COVID-19 crash), stop-loss orders can prevent catastrophic losses. For instance, a trader holding a diversified portfolio with stop losses in place
FAQs
What is a stop loss?
A stop loss is an automatic order that closes a trade at a specific price level to limit potential losses and protect trading capital.
What is a take profit?
A take-profit order closes a trade automatically when the price reaches a predefined profit target, securing gains.
Why are stop losses and take profits important?
They help traders manage risk, lock in profits, and avoid emotional decision-making in volatile markets.
Can I trade without a stop loss or a take profit?
Yes, but it increases risk exposure. Without them, traders must manually monitor positions, which can lead to larger losses or missed profit opportunities.
What is the difference between stop loss and stop limit?
A stop loss executes as a market order once triggered, while a stop limit executes only at a specified price or better, offering more control but no guaranteed fill.
Do stop losses and take profits work in all markets?
Yes, they are widely used in forex, stocks, crypto, and commodities, though execution behavior may vary depending on market liquidity and volatility.
How To Use MACD Strategy In Trading?

The MACD (Moving Average Convergence Divergence) indicator is one of the most widely used technical analysis tools in trading. It helps traders identify changes in momentum, trend direction, and potential buy or sell signals.
The MACD is based on the relationship between two moving averages of an asset’s price—typically the 12-day and 26-day exponential moving averages. It also includes a signal line and a histogram that visually represent market momentum. When the MACD line crosses above the signal line, it may indicate a bullish signal, while a crossover below suggests a bearish trend. It is useful in various financial markets, including forex, stocks, and cryptocurrencies.
What Is the MACD Indicator?
The MACD strategy relies on one of the most popular technical indicators in trading: the Moving Average Convergence Divergence (MACD). Developed by Gerald Appel in the late 1970s, the MACD is a versatile tool used to identify trends, momentum shifts, and potential buy or sell signals.
At its core, the MACD combines two exponential moving averages (EMAs) to generate a single line that oscillates above and below a centerline, while also incorporating a signal line derived from the MACD line itself.
The MACD consists of three key components:
- MACD Line: Calculated by subtracting the 26-period EMA from the 12-period EMA.
- Signal Line: A 9-period EMA of the MACD line, acting as a trigger for signals.
- Histogram: The vertical bars represent the difference between the MACD line and the signal line, showing the strength of the trend.
Traders use the MACD strategy indicator to spot changes in momentum, confirm trend direction, and anticipate reversals. For example, when the MACD line crosses above the signal line, it often signals a bullish momentum shift, while a crossover below may indicate bearish pressure. The histogram’s expansion or contraction further reinforces these signals by showing the gap between the two lines.
One of the MACD’s strengths is its adaptability across different markets—stocks, forex, cryptocurrencies, and commodities—making it a staple in both short-term and long-term trading strategies. However, like all indicators, it works best when combined with other tools, such as volume analysis or support/resistance levels, to filter out false signals.
How to Use MACD in Trading?
Understanding how to use MACD in trading begins with mastering its basic signals and interpreting its components. The MACD is not a standalone solution but a powerful addition to a trader’s toolkit when used correctly. Here’s a step-by-step breakdown of its practical application:
1. Identify the Trend Direction
- If the MACD line is above the signal line, the trend is generally bullish.
- If the MACD line is below the signal line, the trend is bearish.
- The histogram’s position relative to the zero line can also indicate trend strength.
2. Spot Crossover Signals
- Bullish Crossover: When the MACD line crosses above the signal line, it suggests a potential buying opportunity.
- Bearish Crossover: When the MACD line crosses below the signal line, it may signal a selling opportunity.
3. Analyze Divergence
- Regular Divergence: Occurs when price makes a higher high or lower low, but the MACD does not confirm the move with a corresponding signal in momentum, signaling a potential reversal.
- Hidden Divergence: Less common but equally powerful; it happens when the MACD makes a higher high/low while price makes a lower high/higher low, often indicating continuation.
4. Use the Histogram for Confirmation
- Rising histogram bars suggest increasing momentum in the current trend.
- Falling histogram bars may indicate weakening momentum or an impending reversal.
For beginners, starting with the MACD strategy for intraday trading can be highly effective due to its responsiveness to short-term price movements. However, traders must avoid relying solely on MACD signals, as it can produce false positives in choppy or sideways markets. Pairing it with other indicators, such as the Relative Strength Index (RSI) or Bollinger Bands, can significantly improve accuracy.
MACD Trading Strategies
The MACD’s flexibility allows traders to develop various MACD trading strategies tailored to different timeframes and trading styles. Below are some of the most effective approaches:
1. Classic Crossover Strategy
- Buy when the MACD line crosses above the signal line (bullish signal).
- Sell when the MACD line crosses below the signal line (bearish signal).
- Best suited for trending markets.
2. MACD Divergence Strategy
- Look for discrepancies between price action and MACD movements.
- A bullish divergence (price makes a lower low, MACD makes a higher low) may signal a reversal.
- A bearish divergence (price makes a higher high, MACD makes a lower high) can indicate a potential downtrend.
3. MACD Zero-line strategy
- Buy when the MACD line crosses above the zero line (positive momentum).
- Sell when the MACD line crosses below the zero line (negative momentum).
- Works well in ranging markets but may produce lagging signals in strong trends.
4. Triple MACD Strategy
- Combines three MACD indicators with different periods (e.g., 5/13/26, 8/17/34).
- Signals are generated when all three MACDs align in the same direction.
- Reduces false signals but requires more complex analysis.
5. MACD Strategy for Swing Trading
- Focuses on medium-term trends (weeks to months).
- Uses MACD crossovers and divergence to identify entry and exit points.
- Ideal for traders who hold positions for several days to weeks.
For those interested in high-frequency trading, the MACD strategy scalping approach involves using shorter timeframes (e.g., 1-minute or 5-minute charts) to capitalize on quick price movements.
However, scalpers must be cautious, as MACD signals can become noisy during volatile market conditions.
MACD Divergence Explained
MACD divergence is one of the most powerful signals the indicator provides, offering traders early warnings of potential trend reversals. Divergence occurs when the price and MACD move in opposite directions, creating a discrepancy that often precedes a change in momentum. There are two primary types of divergence:
1. Regular (Classic) Divergence
- Bullish Divergence:
- Price makes a lower low.
- MACD makes a higher low.
- Indicates weakening downward pressure and potential reversal to the upside.
Bearish Divergence:
- Price makes a higher high.
- MACD makes a lower high.
- Suggests weakening upward momentum and potential reversal to the downside.
2. Hidden Divergence
Bullish Hidden Divergence:
- Price makes a higher low.
- MACD makes a lower low.
- Often signals continuation of the uptrend but with reduced momentum.
Bearish Hidden Divergence:
- Price makes a lower high.
- MACD makes a higher high.
- Typically indicates continuation of the downtrend but with weakening strength.
To effectively trade divergence, traders should:
- Confirm signals with other indicators (e.g., RSI or volume spikes).
- Wait for additional confirmation, such as a crossover or breakout.
- Avoid trading divergence in strong trends, as it may lead to false signals.
The MACD strategy indicator excels at spotting divergence, making it a favorite among trend-following traders. However, false divergences can occur in choppy markets, so patience and confirmation are key.
Best Times to Trade with MACD
Timing is critical when using the MACD, as its effectiveness varies depending on market conditions and timeframes. Here are the best scenarios to trade with MACD:
Trending Markets
- MACD performs best in strong trends (up or down).
- Crossovers and histogram expansions provide clear signals.
- Avoid trading MACD in sideways or ranging markets, where signals may be unreliable.
High-Volume Sessions
- MACD signals are more reliable during periods of high liquidity.
- Early market hours or news-driven sessions often offer stronger signals.
Avoiding Overbought/Oversold Conditions
- If the MACD histogram is extremely high or low, the market may be overbought or oversold.
- Use additional indicators (e.g., RSI) to confirm before entering trades.
Intraday vs. Swing Trading
- Intraday Trading: Use shorter timeframes (e.g., 5-minute or 15-minute charts) for quick trades.
- Swing Trading: Focus on daily or weekly charts to capture medium-term moves.
- The MACD strategy for intraday trading works well for scalpers but requires tight stop losses.
News and Economic Events
- MACD can be volatile around major news releases.
- Traders should monitor the MACD trading during high-volatility news events but be prepared for sudden reversals.
For day traders, the MACD strategy scalping approach can be profitable if combined with strict risk management. However, scalpers must be disciplined, as MACD signals can be erratic in fast-moving markets.
Entry & Exit Points Using MACD
Determining precise entry and exit points using MACD requires a combination of signal analysis and risk management. Below are structured approaches to maximize profitability:
1. Entry Points
- Crossover Signals:
- Buy on a bullish crossover (MACD > signal line).
- Sell on a bearish crossover (MACD < signal line).
- Divergence Confirmation:
- Wait for the price to break a key level after divergence appears.
Refining Entry & Exit Points Using MACD
While basic crossovers provide entry points, traders can enhance their MACD strategy by incorporating additional filters to reduce false signals:
Volume Confirmation
-
- Ensure volume spikes during a crossover to confirm strength.
- Weak crossovers with low volume may lead to quick reversals.
Support/Resistance Alignment
-
- Enter trades only if the crossover occurs near a key support/resistance level.
- Example: A bullish MACD crossover near a broken resistance zone increases reliability.
Multiple Timeframe Analysis
-
- Confirm the MACD signal on a higher timeframe (e.g., daily chart) before taking an intraday trade.
- Example: A bullish MACD crossover on the 1-hour chart should align with an uptrend on the 4-hour chart.
MACD Histogram Strength
-
- Look for histogram bars expanding (growing in height) during a crossover.
- Shrinking histogram bars may indicate weak momentum, leading to failed signals.
Exit Strategies to Lock in Profits
Exiting a trade at the right time is as crucial as entering. The MACD strategy offers multiple exit approaches:
1. Opposite Crossover
- Exit long trades when the MACD line crosses below the signal line.
- Exit short trades when the MACD line crosses above the signal line.
2. ZeroLine Reversal
- Take profits if the MACD line crosses back below the zero line (for long trades).
- Cover short positions if the MACD line crosses above the zero line.
3. Divergence Exit
- If a bullish divergence appears after entry, consider exiting early to avoid trend reversals.
- Bearish divergence after a long trade may signal an impending downturn.
4. Trailing Stop-loss with MACD
- Adjust stop losses based on MACD histogram behavior.
- Example: Move stops to breakeven if the histogram turns positive after entry.
5. MACD and RSI Combination
- Exit long trades if RSI (14) reaches overbought (>70) while MACD is still bullish.
- Exit short trades if RSI reaches oversold (<30) while MACD remains bearish.
Risk Management with MACD
No MACD trading strategy is foolproof, so risk management is essential:
Risk Management in MACD Trading
• Position Sizing
- Risk only 1–2% of capital per trade, regardless of MACD signal strength.
- Example: If trading a $10,000 account, risk no more than $100–$200 per trade.
• Stop-Loss Placement
- Place stops beyond recent swing highs/lows when using MACD crossovers.
- Example: For a bullish MACD signal, set a stop below the recent swing low.
• Avoiding Overtrading
- MACD can generate multiple signals in volatile markets; wait for high probability setups.
- Example: Avoid taking every crossover in a choppy forex session.
• Backtesting and Journaling
- Test MACD strategies on historical data before live trading.
- Keep a trading journal to refine entry/exit rules based on past performance.
Advanced MACD Techniques
While the MACD strategy is widely used in its basic form, advanced traders employ modified versions and combinations to gain an edge. Below are sophisticated techniques to elevate MACD trading:
Modified MACD Settings for Different Markets
Standard MACD settings (12, 26, 9) work well for stocks and forex, but adjustments can improve performance in other markets:
1. Cryptocurrency MACD Adjustments
- Use faster periods (e.g., 8, 17, 9) due to high volatility.
- Combine with Bollinger Bands to spot breakouts.
2. Commodity MACD Strategies
- Longer periods (e.g., 20, 50, 9) reduce noise in slow-moving markets like gold.
- Pair with moving average convergence for trend confirmation.
3. Forex MACD with ATR Filter
- Use Average True Range (ATR) to filter out low-probability signals.
- Example: Only take MACD crossovers if the move exceeds 1.5x ATR.
4. MACD for Options Trading
- Use MACD divergence to identify potential earnings move reversals.
- Sell straddles/strangles when MACD shows bearish divergence before earnings.
MACD + Other Indicators for Confirmation
No single indicator is perfect; combining MACD with others enhances accuracy:
1. MACD + RSI (Relative Strength Index)
- Buy when MACD crosses bullish, and RSI is above 50.
- Sell when MACD crosses bearish, and RSI is below 50.
2. MACD + Bollinger Bands
- Enter long if MACD crosses bullish while price touches the lower Bollinger Band.
- Exit short if MACD crosses bearish while price touches the upper Bollinger Band.
3. MACD + Volume Weighted Average Price (VWAP)
- Use VWAP as dynamic support/resistance with MACD crossovers.
- Example: Buy if MACD crosses bullish and price holds above VWAP.
4. MACD + Ichimoku Cloud
- Confirm MACD bullish crossovers with price above the Ichimoku Cloud.
- Avoid trades if MACD signals conflict with Cloud resistance/support.
Machine Learning and MACD
Advanced traders and algorithmic systems use MACD in automated strategies:
1. MACD-Based Algorithmic Trading
- Programs can scan multiple timeframes for MACD crossovers and execute trades automatically.
- Example: A bot buys when MACD (12,26,9) crosses bullish on the 5minute chart and sells when it crosses bearish.
2. Neural Networks and MACD
- Machine learning models can predict MACD divergence patterns with higher accuracy.
- Example: AI trained on historical data identifies hidden divergence before humans spot it.
3. MACD in High-Frequency Trading (HFT)
- HFT firms use MACD on tick charts to exploit microprice movements.
- Example: Scalping MACD crossovers on 1-second charts in forex markets.
4. MACD and Sentiment Analysis
- Combine MACD signals with social media sentiment (e.g., Twitter trends).
- Example: A bullish MACD crossover with positive news sentiment increases trade probability.
FAQs
What is the MACD strategy?
The MACD strategy is a technical analysis method used to identify trend direction and momentum. It relies on the Moving Average Convergence Divergence indicator, which compares short-term and long-term moving averages. Traders use MACD crossovers, histogram changes, and signal line interactions to generate buy or sell signals, helping them time entries and exits more effectively in different market conditions.
How does the MACD indicator work?
The MACD indicator works by subtracting the 26-period EMA from the 12-period EMA, creating the MACD line. A 9-period signal line is then plotted to generate trading signals. When the MACD line crosses above or below the signal line, it indicates potential bullish or bearish momentum shifts, helping traders identify trend reversals or continuations.
What is the best MACD trading signal?
The most commonly used MACD trading signal is the crossover between the MACD line and the signal line. A bullish signal occurs when MACD crosses above the signal line, while a bearish signal occurs when it crosses below. Traders often combine this with histogram divergence and trend confirmation tools to increase accuracy and reduce false signals.
Is MACD good for all markets?
MACD is widely used in stocks, forex, and cryptocurrencies, but its effectiveness depends on market conditions. It performs best in trending markets where momentum is clear. In sideways or choppy markets, MACD may produce false signals. Traders often combine it with other indicators like RSI or support and resistance levels for better reliability and filtering.
What are MACD divergences?
MACD divergence occurs when the price moves in the opposite direction of the MACD indicator. A bullish divergence happens when price makes lower lows while MACD makes higher lows, signaling potential upward reversal. A bearish divergence occurs when price makes higher highs while MACD makes lower highs, indicating possible downward momentum and trend reversal.
What is the best MACD strategy for beginners?
For beginners, the simplest MACD strategy is the signal line crossover strategy combined with trend confirmation. Traders wait for MACD to cross above or below the signal line in the direction of the overall trend. Using higher timeframes and avoiding sideways markets can improve accuracy. Risk management is essential to avoid losses from false signals.