How to Master Moving Averages and How to Use Smart Trading Strategies

How to Master Moving Averages and How to Use Smart Trading Strategies

Welcome to a comprehensive guide on how to boost your earnings with moving averages and understand crucial support and resistance levels for smart trading.
In this article, we will explore the fascinating world of trading and the role that moving averages play in achieving success in the financial markets. Whether you’re a novice or an experienced trader, this guide is packed with valuable insights and practical knowledge to enhance your trading strategies.


Table of contents

Understanding Moving Averages
Crucial Support and Resistance Levels

Conclusion


Understanding Moving Averages

are fundamental tools in trading, providing a clear and visual representation of an asset’s price trend over a specified period. They smooth out price data to identify trends, making them essential for traders. Let’s delve into the details.


What Are Moving Averages?

Moving averages are statistical calculations that average an asset’s price over a specific period.
They help traders analyze trends and make informed decisions based on historical data.

There are various moving averages, including simple moving averages (SMA) and exponential moving averages (EMA).

Each has its unique characteristics and is suited for different trading strategies.

Learn how to incorporate moving averages into your trading strategy effectively.
These tools can help you identify potential entry and exit points.


Crucial Support and Resistance Levels

Support and resistance levels are key elements in trading.
Understanding these levels can make a significant difference in your trading success.

Support levels are price points where an asset tends to find buying interest, preventing it from falling further.
Discover how to spot and use support levels to your advantage.

Resistance levels are price points where an asset faces selling pressure, preventing it from rising further.
Learn how to identify and leverage resistance levels in your trading decisions.


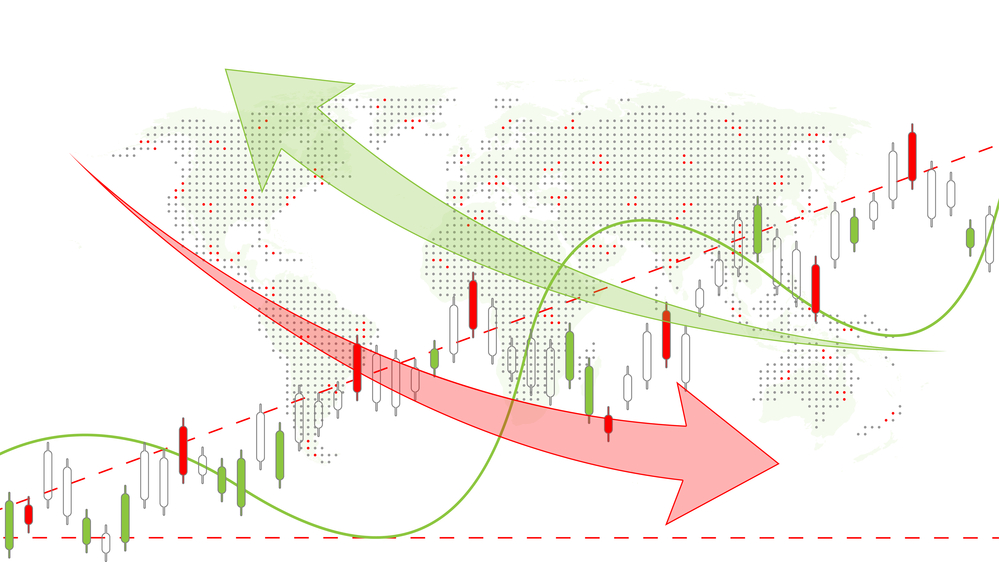
Combining Moving Averages with Support and Resistance

Successful trading often involves combining various technical indicators.
Discover how you can use moving averages in conjunction with support and resistance levels for smarter trading.


How to Master Moving Averages and How to Use Smart Trading Strategies


Conclusion

As with any trading strategy, there are pitfalls to be aware of.
Here are some common mistakes to avoid when using moving averages and support and resistance levels in your trading.


In the world of trading, understanding how to boost your earnings with moving averages and recognizing crucial support and resistance levels is crucial.
This article has provided you with valuable insights, tips, and techniques to enhance your trading strategies.
By applying the knowledge gained here, you’ll be better equipped to navigate the financial markets with confidence and success.


FAQs

How can moving averages help me in trading?

Moving averages provide a clear representation of an asset’s price trend,
helping traders make informed decisions based on historical data.


What is the difference between SMA and EMA?

SMA gives equal weight to all data points, while EMA gives more weight to recent data.


How do I identify support levels in trading?

Support levels are price points where assets find buying interest.
You can identify them by looking for areas where prices consistently stop falling.


What are the resistance levels in trading?

Resistance levels are price points where assets face selling pressure.
Identifying these levels can help you make smarter trading decisions.


Can I use moving averages and support and resistance levels together in trading?

Absolutely. Combining these tools can provide valuable insights for your trading strategies.


What are the most common mistakes traders make when using these strategies?

Common mistakes include using outdated data, relying solely on one indicator,
and not considering market conditions.


How to Master Moving Averages and How to Use Smart Trading Strategies

Understanding Moving Averages

Understanding Moving Averages: A Key Tool for Traders

As a fundamental technical analysis tool, moving averages hold immense significance for both novice and seasoned traders. In this comprehensive guide, we’ll delve into the intricacies of moving averages and shed light on two essential techniques that traders employ to identify price trends and recognize potential zones of support and resistance. Join us as we explore the world of moving averages and how they can empower your trading journey.


Table of contents
Introduction to Moving Averages
Zones of Support and Resistance
Exploring the Evest Trading Academy
Conclusion


Introduction to Moving Averages

Moving averages have become a cornerstone of technical analysis in the trading world. These indicators are widely used by traders, regardless of their experience level, due to their ability to provide valuable insights into market trends. At its core, a moving average smooths out the inherent volatility of prices, enabling traders to discern overarching trends.


The Role of Moving Averages

A moving average is a representation of the average market price over a specific time, typically measured in candlesticks. This statistical tool assists traders in deciphering the overall market direction by filtering out short-term fluctuations that might obscure the bigger picture.


Confirming Price Trends

One of the primary applications of moving averages is to confirm price trends. By plotting moving averages onto price charts, traders can identify the prevailing trend direction. When the price consistently stays above a moving average line, it indicates an uptrend. Conversely, when the price consistently drops below the moving average line, it signifies a downtrend. This visual confirmation helps traders make informed decisions.


Zones of Support and Resistance

Moving averages also play a crucial role in identifying zones of support and resistance. A moving average line can act as a dynamic level that prices often gravitate towards. During an uptrend, a moving average can act as a support level, preventing prices from falling further. Similarly, during a downtrend, the same moving average can turn into a resistance level, preventing prices from rising easily.


The Power of the 50-Day Simple Moving Average

The 50-day Simple Moving Average (SMA) is a widely followed indicator that holds significant importance among traders. When the price crosses above the 50-day SMA, it signals a potential uptrend in the making. Conversely, a downward cross suggests the onset of a downtrend. This crossover strategy can be a reliable tool for traders to enter or exit positions.


Utilizing Moving Averages for Informed Decisions

Experienced traders understand that moving averages are not just about the lines themselves; they’re about what these lines represent. A moving average is a reflection of market sentiment, providing insights into how traders collectively perceive an asset’s value over time.


Exploring the Evest Trading Academy

To gain a deeper understanding of how moving averages can transform your trading strategies, we invite you to explore the Evest Trading Academy. Our academy is a treasure trove of educational resources designed to empower traders of all levels. From beginner-friendly guides to advanced trading techniques, you’ll find a wealth of knowledge to enhance your trading acumen.


Conclusion

In conclusion, moving averages are a fundamental tool that traders can utilize to navigate the complexities of the financial markets. Whether you’re a seasoned trader looking to refine your strategies or a beginner eager to learn, understanding moving averages can undoubtedly elevate your trading game. By effectively leveraging moving averages, you’ll be better equipped to identify trends, pinpoint support and resistance zones, and make informed trading decisions.


FAQs:


Q1: How do moving averages differ from other technical indicators?
A1: Unlike many technical indicators that focus on specific aspects of price action or market conditions, moving averages provide a broader perspective by smoothing out price volatility over a given period. They offer insights into trends and help traders identify potential support and resistance zones.


Q2: Can moving averages be used in conjunction with other tools?
A2: Absolutely! Moving averages can be combined with a wide range of technical indicators and chart patterns to enhance trading strategies. Many traders use moving averages alongside oscillators, trend lines, and other tools to validate signals and make more informed decisions.


Q3: Are moving averages equally effective in all types of markets?
A3: While moving averages can be effective in various market conditions, their performance might vary. In strongly trending markets, moving averages can provide clear signals. However, during sideways or ranging markets, moving averages might generate false signals. It’s essential to adapt your strategies based on market conditions.


Q4: What is the significance of the 50-day Simple Moving Average?
A4: The 50-day Simple Moving Average (SMA) is a widely watched indicator used by traders to gauge the short- to medium-term trend of an asset. When prices cross above the 50-day SMA, it often signals a potential uptrend, while a downward cross suggests a potential downtrend.


Q5: How can I access the Evest Trading Academy?
A5: Accessing the Evest Trading Academy is easy. Simply visit our website at Evest.com and navigate to the “Education” or “Academy” section. There, you’ll find a wealth of free educational resources designed to help you enhance your trading skills and understanding of moving averages.


Understanding Moving Averages

Unlocking the Power of Moving Averages

Unlocking the Power of Moving Averages
In the ever-evolving world of financial markets, traders are always on the lookout for tools that can help them make informed decisions.
One such tool that has stood the test of time is the “Moving Average” (MA).


Table of contents
A Guide for Traders
Confirming Price Trends
Conclusion


A Guide for Traders

Whether you’re a seasoned trader or just starting your journey into the world of finance, understanding how to use moving averages can be a game-changer in your trading strategy. In this article, we’ll delve into the fundamentals of moving averages and explore two essential techniques that traders of all levels can use to identify price trends and potential zones of support and resistance.


What Are Moving Averages?
Before we dive into the techniques, let’s first understand what moving averages are and why they are so crucial in the realm of technical analysis.


The Basics of Moving Averages
A moving average is a statistical calculation that smooths out price volatility by taking the average market price over a specific period of time, typically counted in candlesticks. This calculation provides traders with a more stable and clear view of the market’s overall trend.


Traders often use moving averages to confirm price trends. By plotting the moving average on a price chart, you can easily identify whether the market is in an uptrend or a downtrend.


Identifying Support and Resistance
Moving averages can also act as dynamic zones of support and resistance. These critical levels help traders determine potential entry and exit points for their trades.


The Two Basic Techniques
Now that we have a solid foundation, let’s explore the two fundamental techniques that traders use with moving averages.


Technique 1 – Riding the Trend
One of the most popular ways to use moving averages is to ride the trend. When the market is in an uptrend, you’ll notice that the price often stays above the moving average. Conversely, in a downtrend, the price tends to stay below it. For instance, when the price crosses above the 50-day Simple Moving Average (SMA), it’s a strong indicator of an uptrend.


Technique 2 – Support and Resistance
Moving averages can also be dynamic support and resistance levels. During a downtrend, the moving average may act as resistance, preventing the price from rising too quickly. In contrast, during an uptrend, the moving average can act as support, providing a cushion for the price.


Conclusion

In conclusion, moving averages are a fundamental technical analysis tool that every trader should have in their arsenal. Whether you’re a beginner or an experienced trader, these versatile indicators can help you navigate the complexities of the financial markets. By using moving averages to confirm price trends and identify support and resistance zones, you can make more informed trading decisions.

To dive deeper into the world of trading and learn how moving averages can elevate your trading game, visit our 100% free trading academy at Evest.com.


FAQs


FAQ 1: What is a moving average?
A moving average is a statistical calculation that smoothes out price volatility by averaging the market price over a specific time period.


FAQ 2: How do I use moving averages in trading?
Traders use moving averages to confirm price trends and identify potential support and resistance levels.


FAQ 3: What is the significance of the 50-day Simple Moving Average?
When the price crosses above the 50-day SMA, it often indicates an uptrend in the market.


FAQ 4: Can moving averages be used in all financial markets?
Yes, moving averages are a versatile tool that can be applied to various financial markets, including stocks, forex, and cryptocurrencies.


FAQ 5: Where can I learn more about trading with moving averages?
To expand your knowledge of trading techniques involving moving averages, visit our trading academy at Evest.com


Unlocking the Power of Moving Averages