
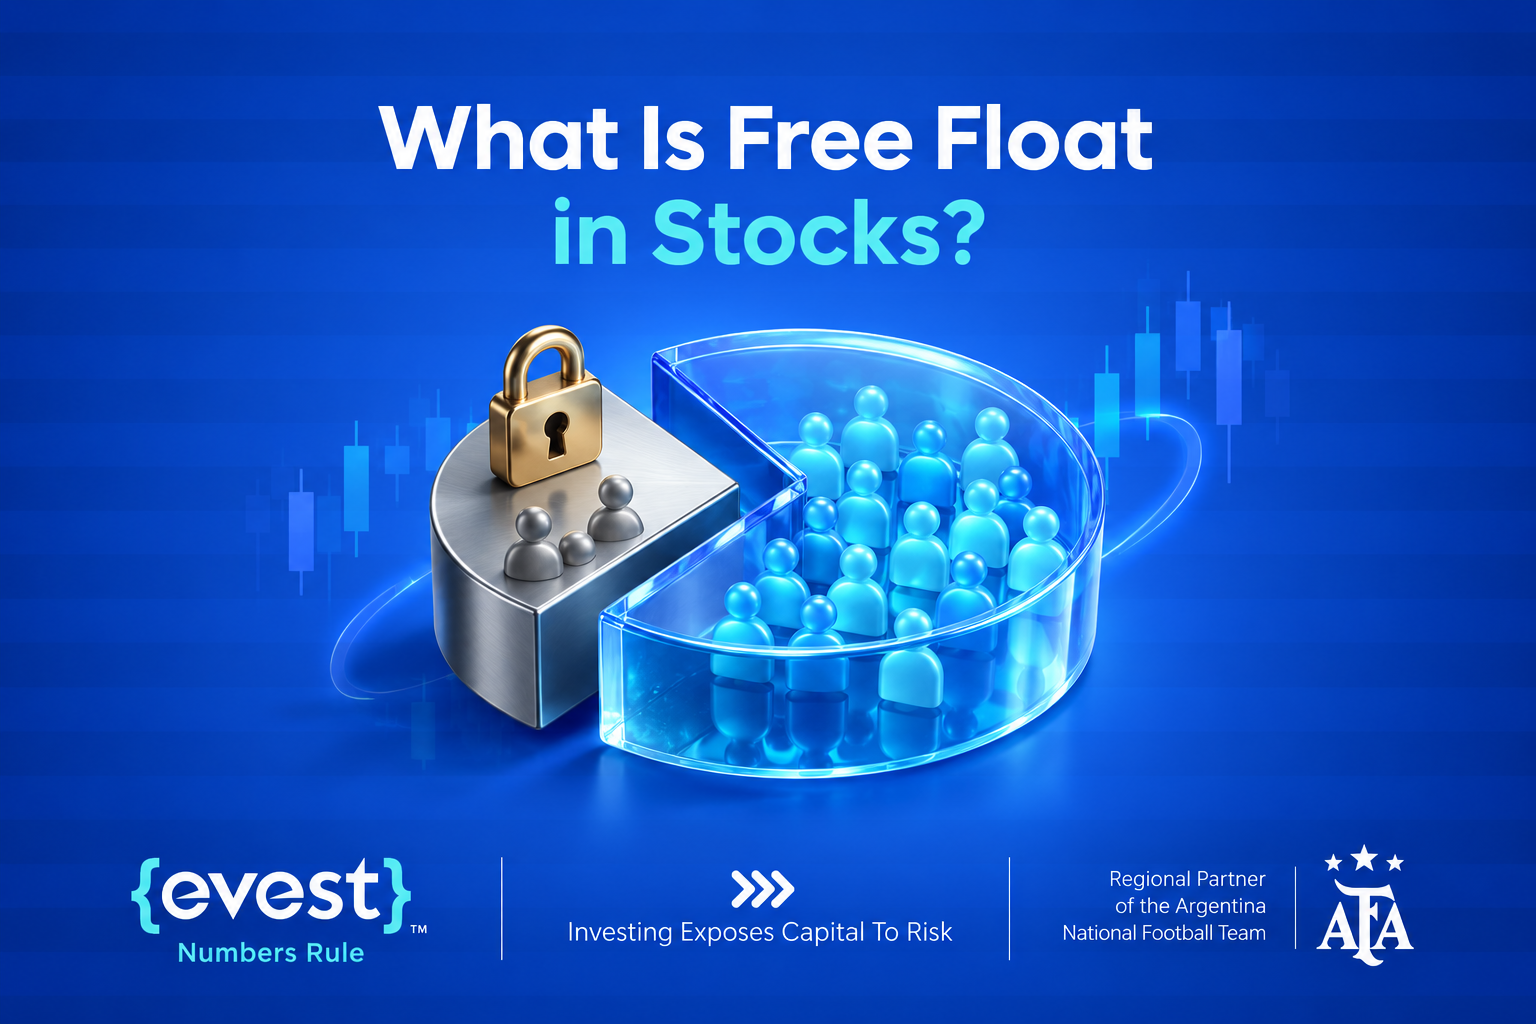
Understanding what is free float in stocks is helps investors see how many company shares are actually available for public trading, This figure can influence a stock’s liquidity, price volatility, and the ease of buying or selling shares in the market.
It excludes certain holdings, such as shares owned by controlling shareholders, governments, or strategic investors. Knowing the available share supply also gives investors better context when comparing companies and analysing market activity.
For this reason, free float is an important metric to consider alongside trading volume, market capitalization, and ownership structure.
What Is Free Float in Stocks?
Free float is the number of a company’s outstanding shares that are considered readily available for trading by the public. It excludes shares that are unlikely to enter normal market circulation because they are held by controlling shareholders, governments, strategic investors, insiders, or other long-term holders. The exact exclusions can vary by exchange or index methodology, so free float is best understood as a measure of tradable share supply rather than a fixed accounting category.
For investors searching for a clear free float definition in stocks, the key idea is simple: a company may have a large number of shares outstanding, but only part of that total may be available for active market trading. That difference can affect how easily orders are executed and how sensitive the stock may be to changes in supply and demand.
Key characteristics of free float include:
- It represents shares considered available for public trading.
- It is a subset of total shares outstanding.
- It can influence liquidity, volatility, and market depth.
- It is often used when calculating free float market capitalization.
A higher free float does not automatically make a company better, and a lower free float does not automatically make it worse. The figure should be interpreted alongside trading volume, spreads, ownership concentration, company size, and market conditions.
Free Float vs Total Shares Outstanding
| Comparison Point | Total Shares Outstanding | Free Float |
| Definition | All shares currently issued and held by shareholders. | The portion of shares considered available for public market trading. |
| Included shareholders | May include founders, strategic investors, institutions, governments, and the public. | Generally excludes shares held by controlling founders, strategic investors, and other restricted holders. |
| Example | A company has 100 million total shares outstanding. | If 60 million shares are held by restricted or strategic holders, the remaining 40 million shares form the free float. |
| What it measures | The company’s entire issued share base currently held by shareholders. | The shares available for normal market trading. |
| Market impact | A large share count does not necessarily mean that many shares are actively traded. | A smaller tradable supply may make the share price more sensitive to changes in market demand. |
| Why it matters | Helps assess the company’s full ownership structure and market capitalization. | Helps explain differences in liquidity and price sensitivity between companies with similar market capitalizations. |
Which Shares Are Usually Excluded From Free
Float?
Free float calculations start with outstanding shares and then remove holdings that are not considered part of the normal tradable supply. The exact treatment depends on the methodology being used, so investors should avoid assuming that every market applies identical rules.
Common exclusions may include:
- Shares held by controlling founders or major insiders.
- Strategic holdings maintained for long-term influence or control.
- Certain government or state holdings.
- Shares subject to lock-up or other trading restrictions.
- Treasury shares held by the company itself, where applicable.
- Other concentrated holdings classified as non-free float.
One point requires care: unexercised employee stock options are not the same as outstanding shares. Because they have not yet become issued shares, they should not simply be deducted again from total shares outstanding. Employee or insider shares that are already outstanding may be treated differently depending on ownership and market rules.
Changes in ownership can also alter the float. A founder selling part of a strategic stake, a lock-up expiring, a company buying back shares, or a new strategic investor taking a large position can change the quantity of shares available to the market.
How to Calculate Free Float?
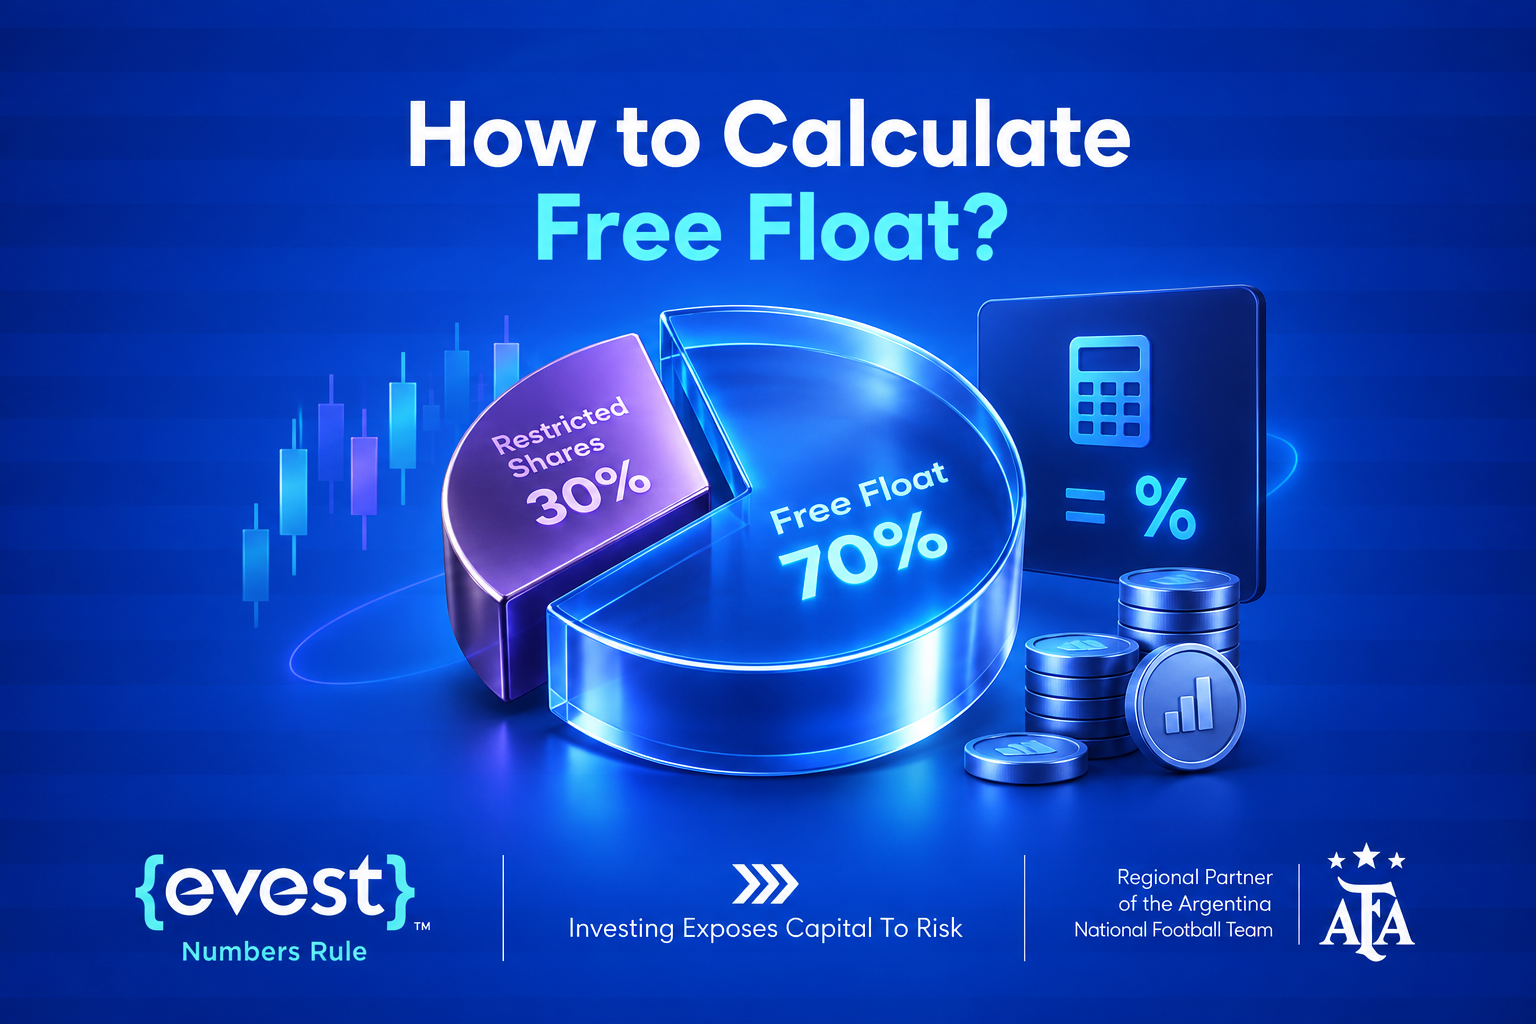
Investors asking how to calculate free float can use a straightforward framework: start with total shares outstanding and subtract the shares classified as non-free float under the chosen market or index methodology.
Free Float = Total Shares Outstanding − Non-Free-Float Shares
A practical calculation can be completed in four steps:
- Identify the company’s total shares outstanding.
- Identify controlling, strategic, restricted, government, or other excluded holdings.
- Add the excluded holdings together.
- Subtract that total from shares outstanding to estimate free float.
Assume a company has 500 million shares outstanding. Its controlling shareholders hold 180 million shares, a strategic partner owns 40 million, and another 30 million shares are restricted. Total excluded holdings equal 250 million shares. The company would therefore have 250 million free float shares.
This calculation is useful, but investors should verify how the relevant exchange, data provider, or index provider classifies specific holdings. The same ownership block can sometimes be treated differently depending on the rules being applied. For analysis, consistency matters more than forcing every market into one universal formula.
Free Float Percentage Meaning: What the Number Tells You?
The free float percentage expresses tradable shares as a percentage of total shares outstanding. It makes comparison easier because the raw number of shares can vary dramatically between companies.
Free Float Percentage = (Free Float Shares ÷ Total Shares Outstanding) × 100
If a company has 250 million free float shares out of 500 million shares outstanding, its free float percentage is 50%. That means half of the company’s outstanding share base is classified as available for public trading under the methodology being used.
The free float percentage meaning should not be reduced to “higher is good” or “lower is bad.” A larger percentage can support broader market participation, but actual liquidity also depends on trading activity, investor demand, company size, and market structure.
When interpreting the percentage, consider:
- Average daily trading volume.
- Bid-ask spread and market depth.
- Ownership concentration.
- Market capitalization and investor participation.
There is no universal free float percentage that automatically makes a stock attractive. The number is most useful when compared with other liquidity and ownership indicators.
Free Float Market Capitalization
Free float market capitalization measures the market value of the shares considered available for public trading. It differs from full market capitalization, which uses the company’s total outstanding shares.
Full market capitalization is commonly calculated as share price multiplied by total shares outstanding. Free float market capitalization instead uses only free float shares:
Free Float Market Capitalization = Share Price × Free Float Shares
Suppose a company has 100 million shares outstanding, 60 million free float shares, and a share price of $10. Its full market capitalization would be $1 billion, while its free float market capitalization would be $600 million.
This adjusted figure focuses on the market value of the investable or tradable portion of the equity. It should not be described as the company’s “true value.” Full market capitalization and free float market capitalization answer different questions. The first reflects the market value of the full outstanding share base; the second reflects the market value of the portion considered freely tradable.
The metric is especially relevant when analysing index weighting, ownership concentration, and whether a large company has a relatively small publicly tradable share base.
How Free Float Affects Liquidity, Volatility, and Market Depth?
Free float matters because share supply influences how easily the market can absorb orders. When more shares are available and actively traded, there is generally more capacity for buyers and sellers to transact without producing an outsized price impact. When the float is limited, available supply can become more sensitive to changes in demand.
Liquidity is not determined by free float alone, but the two are connected. A stock with a large float and strong trading participation may offer tighter spreads and more consistent execution. A low-float stock may have fewer shares available at each price level, increasing slippage when traders place larger orders.
The practical effects can appear in several ways:
- Higher free float can support deeper trading activity when demand is present.
- Low free float can amplify price moves when buying or selling pressure changes quickly.
- Thin market depth can cause larger orders to move through several price levels.
- Wider bid-ask spreads can increase the cost of entering and exiting positions.
- Sudden changes in sentiment can have a stronger effect when tradable supply is limited.
Volatility should still be analysed in context. Earnings releases, macroeconomic news, sector events, company size, leverage, and investor positioning can all move a stock. Free float helps explain market structure; it does not predict price direction.
Low Free Float vs High Free Float Stocks
| Comparison Point | Low Free Float Stocks | High Free Float Stocks |
| Tradable share supply | A smaller quantity of shares is available to absorb trading demand. | A broader supply of tradable shares is available. |
| Price reaction | Relatively small changes in order flow may produce larger price movements. | Broader supply may reduce sensitivity to individual order-flow changes. |
| Trading conditions | May experience fast movements, wider spreads, and greater execution risk. | May make it easier for market participants to enter and exit positions. |
| Liquidity | Can be associated with thinner liquidity. | Can support broader liquidity and deeper market participation. |
| Slippage risk | Generally carries higher slippage risk, especially during news or speculative activity. | May reduce execution pressure when buyers and sellers are active. |
| Important limitation | Low free float is not automatically a buy or sell signal. | High free float does not guarantee high liquidity if investor interest and trading volume are weak. |
How Traders Can Use Free Float in Stock Analysis?
For Evest readers, free float is most useful as part of a broader stock-analysis process. It can help explain why two stocks with similar company sizes behave differently when orders enter the market. It can also reveal when ownership concentration makes tradable supply much smaller than the headline share count suggests.
A practical analysis can follow five steps:
- Check the company’s total shares outstanding and reported free float.
- Calculate or confirm the free float percentage.
- Compare free float with average daily volume and recent turnover.
- Review bid-ask spreads, volatility, and market depth where data is available.
- Examine major shareholders and recent ownership changes that may affect tradable supply.
For example, a company with a 25% free float may deserve closer liquidity analysis than a company with an 80% free float, but the percentage alone cannot determine which stock is easier to trade. If the first company has very high daily turnover and the second has little investor activity, actual execution conditions may differ from what the percentages initially suggest.
Free float should answer a specific question: how much of the company’s share base is realistically available to participate in the market? The trading decision still requires valuation, risk analysis, fundamentals, price behaviour, and current market conditions.
Why Free Float Matters for Market Indices?
Many equity indices aim to represent the portion of the market that investors can realistically access.
- For that reason, some index providers adjust a company’s market capitalization for free float when determining eligibility or weighting.
- The methodology differs by benchmark, so investors should always check the rules of the specific index.
- A free-float adjustment can reduce the influence of shares held by founders, governments, strategic investors, or other long-term holders.
- This means free float may affect index eligibility, company weighting, and trading activity around index reviews or rebalancing. It is therefore relevant beyond daily liquidity, but the same float level can be treated differently across benchmarks.
What Free Float Cannot Tell You?
Free float is useful, but it is not a measure of business quality, profitability, valuation, or future returns. A company can have a large free float and weak fundamentals. Another can have a small free float and strong financial performance. The metric describes ownership and tradable supply, not whether a stock is undervalued or likely to rise.
It also cannot replace direct liquidity data. Trading volume, spread, turnover, and market depth show what is actually happening in the market. Free float helps explain the structure behind that activity.
Before using free float in a trading decision, keep three limits in mind:
- It does not predict whether the stock price will rise or fall.
- It does not guarantee liquidity or low volatility.
- It does not measure corporate governance or financial strength by itself.
Free float becomes more useful when treated as one input within a larger analytical framework. That approach reduces the risk of turning a structural market metric into a simplistic trading signal.
FAQs
Does free float change after an IPO?
Yes. Free float can change when lock-up restrictions expire, early shareholders sell, new shares are issued, or the company repurchases stock. The timing and size of those changes depend on ownership activity, offering terms, market rules, and classification methods used.
Can a stock have high free float but low liquidity?
Yes. A large free float means many shares are available for trading, but liquidity also requires active buyers and sellers. Low investor interest, weak trading volume, wide spreads, or limited market participation can still make a high-float stock relatively illiquid.
Does a stock buyback reduce free float?
It can. When a company repurchases shares, those shares may become treasury shares and may no longer count toward tradable float, depending on the market methodology. The effect also depends on whether the repurchased shares are cancelled or retained afterward.
Why can free float data differ between platforms?
Different data providers may apply different definitions, ownership thresholds, update schedules, or classifications for strategic and restricted holdings. As a result, reported free float figures can vary. For accurate comparisons, investors should use one consistent source and methodology whenever possible.
Is low free float always a warning sign?
No. Low free float is not automatically negative, but it can increase sensitivity to order flow, slippage, and volatility. Investors should evaluate trading volume, spreads, ownership concentration, company fundamentals, and market conditions before deciding how significant the float really is.