
The Keltner Channel Indicator is a volatility-based technical analysis tool that helps traders evaluate trend direction, price momentum, and potential breakout conditions. It uses an exponential moving average as its center line and Average True Range to position the upper and lower bands. Because the channel expands and contracts with volatility, it can adapt to changing market conditions more effectively than fixed price envelopes. In this Evest guide, we explain the Keltner Channel Indicator, its formula, common settings, practical trading strategies, breakout logic, limitations, and the main factors traders should consider before using it in a broader technical analysis process.
What Is the Keltner Channel Indicator?
The Keltner Channel Indicator is a three-line volatility envelope plotted around price. Its middle line is usually an exponential moving average, while the upper and lower bands are calculated by adding and subtracting a multiple of Average True Range. Together, the three lines create a dynamic channel that reacts to both market direction and changing volatility.
The indicator helps traders place price action in context. A rising channel can support a bullish trend interpretation, while a falling channel can support a bearish one. A narrow channel may point to reduced volatility, while a widening channel shows that recent price movement is becoming more active.
The Keltner Channel Indicator has four main components:
- The middle line, usually an EMA, reflects the underlying price direction.
- The upper band is positioned above the EMA using an ATR multiple.
- The lower band is positioned below the EMA using the same ATR multiple.
- ATR measures recent volatility and determines how wide the channel becomes.
A move beyond either band does not automatically mean that price will continue in that direction. The channel is best used as a framework for reading trend, volatility, and market structure rather than as a standalone signal.
Keltner Channel Formula: How It Is Calculated?
The Keltner Channel formula combines a moving average with Average True Range. The modern version generally uses an EMA for the center line and ATR to calculate the distance of the outer bands.
Middle Line = EMA
Upper Band = EMA + (ATR × Multiplier)
Lower Band = EMA − (ATR × Multiplier)
For example, if the EMA is 100, ATR is 2, and the multiplier is 2, the upper band would be 104 and the lower band would be 96. If ATR rises to 3 while the EMA stays at 100, the bands would widen to 106 and 94.
That example shows why the indicator adapts to volatility. ATR measures the size of recent price movement, not direction. When market movement becomes larger, the channel widens. When movement becomes quieter, it contracts.
The EMA provides the directional reference. If the middle line is rising and price is spending more time above it, traders may view momentum as bullish. If the EMA is falling and price stays below it, the structure may support a bearish interpretation. Channel width and channel direction therefore answer different questions and should be read together.
Keltner Channel Settings: Common Parameters
Keltner Channel settings determine how quickly the indicator reacts to price and how far the outer bands sit from the EMA. The main variables are the EMA period, ATR period, and ATR multiplier.
A commonly used setup is:
- EMA Period: 20
- ATR Multiplier: 2
- Some charting platforms may also allow a separate ATR period.
These values are useful as a starting point, but they should not be treated as universally optimal.
How the EMA Period Affects the Indicator?
A shorter EMA makes the center line more responsive to recent price changes. That can help capture shorter moves, but it can also increase noise.
A longer EMA creates a smoother line and may be more useful when the goal is to assess broader trend direction.
How the ATR Multiplier Changes the Channel?
The ATR multiplier changes the channel width:
- A smaller multiplier produces tighter bands, so price will reach or cross them more often.
- A larger multiplier creates a wider channel and reduces the frequency of outer-band touches.
Choosing the Best Keltner Channel Settings
The best Keltner Channel settings depend on:
- The market.
- The timeframe.
- The purpose of the analysis.
Forex pairs, indices, commodities, and other instruments can behave differently.
Traders can compare multiple settings across historical periods, but they should avoid adjusting parameters simply to make past results look better. The goal is consistency, not a perfect backtest.
How to Use Keltner Channel Signals?
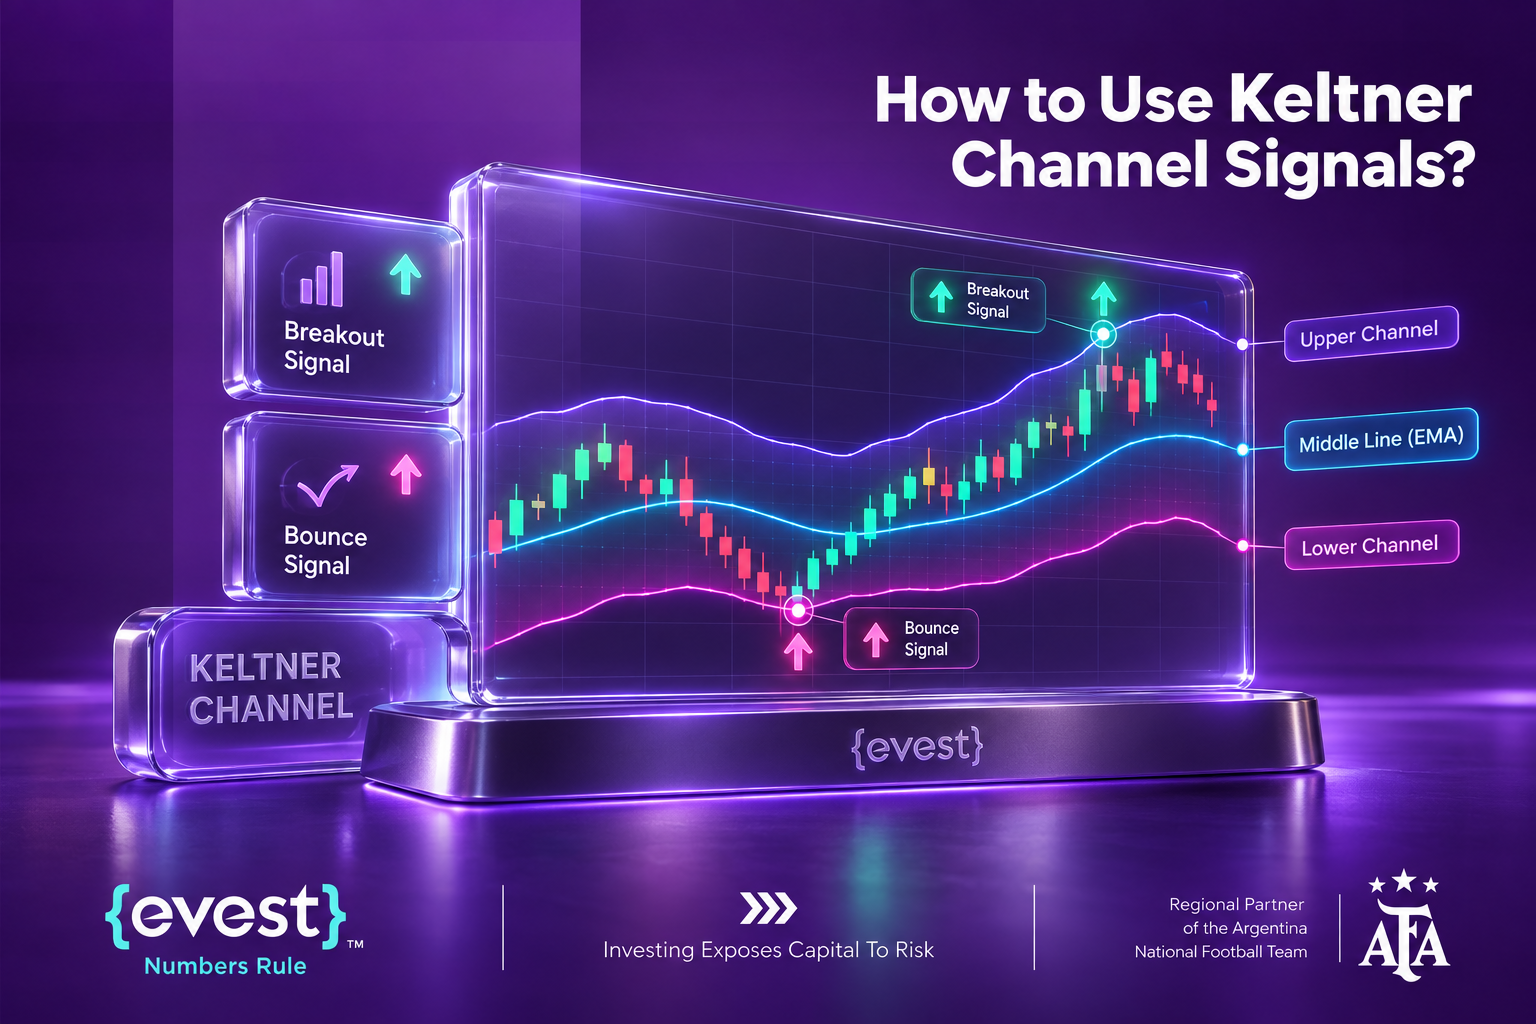
Understanding how to use Keltner Channel signals starts with the relationship between price, the middle EMA, the channel slope, and the outer bands.
- When price holds above the middle line and the channel slopes upward, the structure can support a bullish trend view.
- When price holds below the middle line and the channel slopes downward, it can support a bearish view. If the center line is flat and price repeatedly crosses it, directional momentum may be weak.
- The outer bands add volatility context. During a strong uptrend, price may repeatedly trade near the upper band. That does not automatically mean the market is overbought.
- It may simply show that bullish momentum remains strong, The same principle applies when price stays near the lower band during a sustained downtrend.
- Channel width also matters. A contracting channel can indicate that recent volatility is decreasing.
- If the channel begins to expand as price moves decisively, traders may monitor the move for a possible transition from consolidation into a more active phase.
- The practical sequence is simple: first identify whether the market is trending or ranging, then check the channel slope and price position, and finally compare the signal with support, resistance, candlestick structure, momentum, or volume where relevant. This reduces the risk of treating every band touch as meaningful.
Keltner Channel Strategy for Trending and Ranging Markets
A Keltner Channel strategy should change with market conditions. The same outer-band signal can mean something very different in a strong trend than in a sideways market.
| Market Condition | How the Keltner Channel Strategy Works |
| Trending Market | In a trend-following approach, traders often use the middle EMA as a reference. If the channel slopes upward and price remains mostly above the EMA, a pullback toward the center line may be monitored to see whether buyers are still supporting the trend. In a downward trend, the opposite logic can be applied. |
| Flat or Unclear Trend | This approach becomes less reliable when the channel flattens and price repeatedly moves from one side of the EMA to the other. That behavior can indicate a range rather than a stable trend. |
| Ranging Market | In a range, the outer bands may help visualize areas where price has repeatedly stretched away from the average. However, touching an outer band is not enough to assume that a reversal will follow. Strong directional moves can continue along a band for longer than expected. |
A useful Keltner Channel strategy therefore combines trend direction, volatility, price structure, and confirmation. For Evest readers, the indicator is most useful when it helps organize evidence rather than replace judgment.
Keltner Channel Breakout Strategy
A Keltner Channel breakout strategy focuses on price moving beyond the upper or lower band, particularly after consolidation or lower volatility. The idea is to identify a shift from a quieter market into a stronger directional move.
A close above the upper band can signal increasing bullish momentum, while a close below the lower band can signal increasing bearish momentum. Still, a single close outside the channel does not guarantee that a new trend has started.
A practical breakout review can follow three steps:
- Check whether the channel was relatively narrow or price was consolidating before the breakout.
- Look for a clear close beyond the band instead of relying only on an intraday spike.
- Compare the breakout with market structure, momentum, volume where relevant, or a retest.
The quality of the move matters more than the fact that price crossed a band. A breakout that also clears an established resistance or support level may carry more context than a move occurring in the middle of an irregular range.
False breakouts remain a key limitation. If price quickly returns inside the channel, the move may not have had enough momentum to continue. Waiting for additional evidence can help filter some weak setups, although no confirmation method eliminates false signals completely.
Traders should also watch volatility after a breakout. If the channel expands sharply, price can move faster and risk can increase. The Keltner Channel breakout strategy can highlight that change, but it cannot determine a suitable position size or risk level for an individual trader.
Keltner Channel vs Bollinger Bands
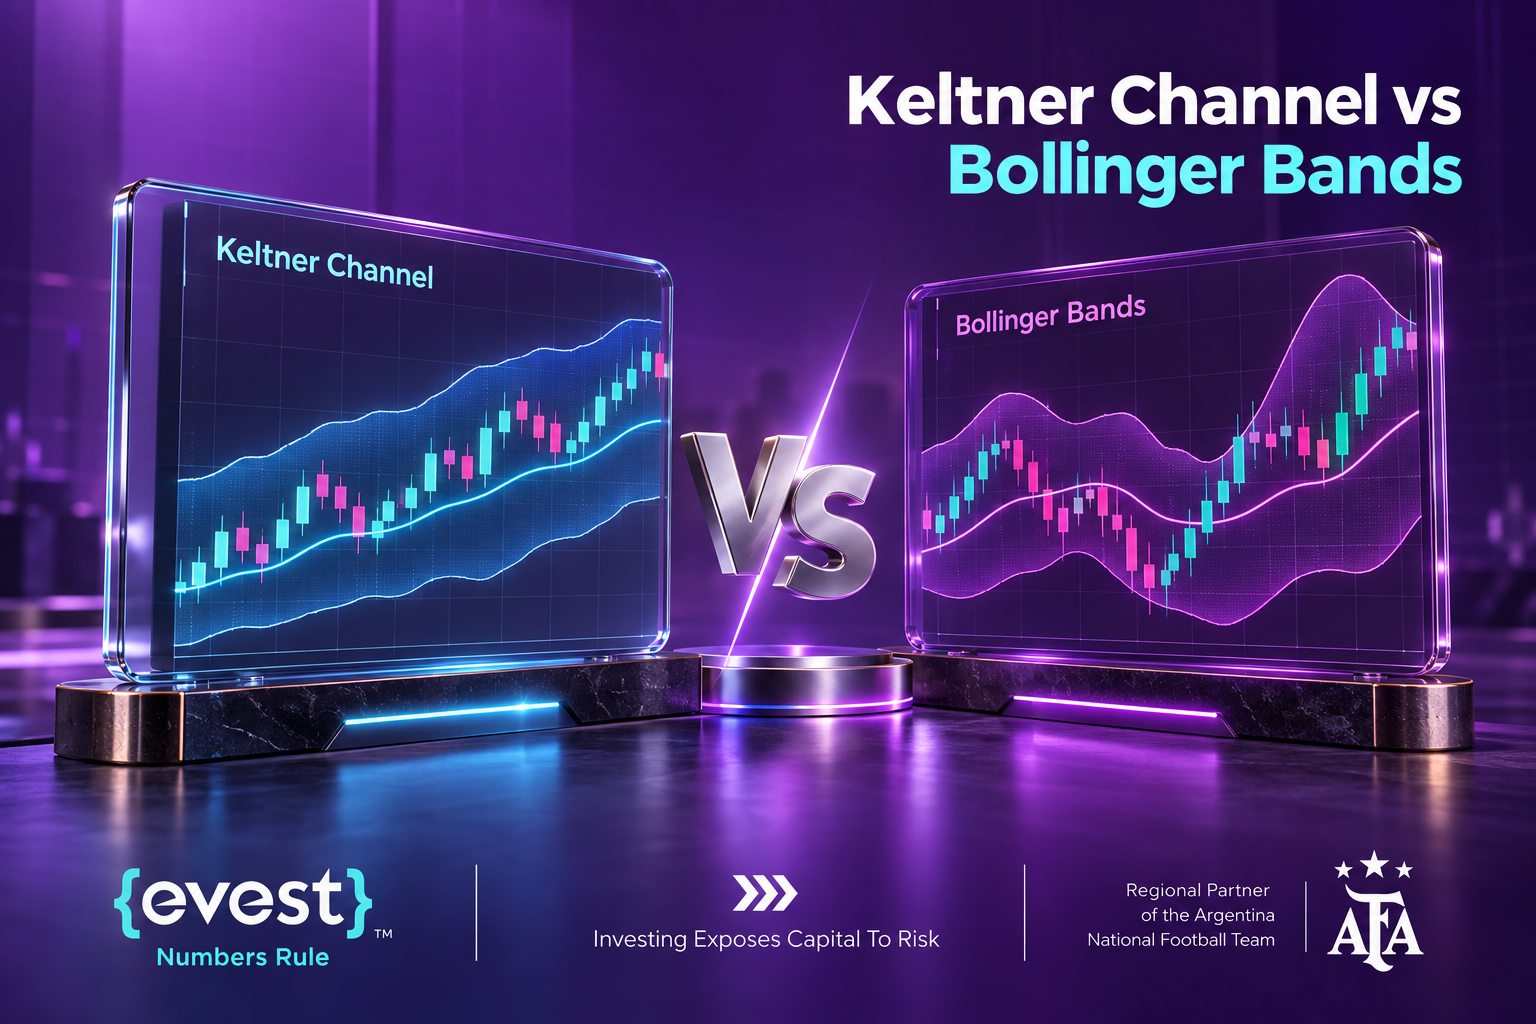
Keltner Channels and Bollinger Bands are both volatility-based tools, but they calculate their outer bands differently. Keltner Channels generally use ATR, while Bollinger Bands typically use standard deviation.
| Comparison Point | Keltner Channels | Bollinger Bands |
| Volatility Measurement | Use ATR to calculate the outer bands. ATR focuses on the range of recent price movement. | Use standard deviation to calculate the outer bands. Standard deviation measures how widely prices are dispersed around an average. |
| Band Behavior | Keltner Channels may appear smoother because their bands are based on ATR. | Bollinger Bands can sometimes react more sharply when price dispersion changes. |
| When Traders May Prefer Them | Traders may prefer the Keltner Channel Indicator when they want ATR-based volatility combined with a clear trend reference. | Bollinger Bands may be more suitable when the main focus is price dispersion and volatility expansion or contraction around a moving average. |
Neither indicator is automatically better. Some traders compare both indicators, but adding more tools does not automatically improve analysis. Each indicator should answer a specific question. If two tools provide nearly identical information, the extra complexity may not add value.
Common Mistakes When Using the Keltner Channel Indicator
- One common mistake is assuming that every upper-band touch means price is overbought or every lower-band touch means it is oversold.
- In strong trends, price can remain near an outer band for an extended period.
- Another mistake is changing Keltner Channel settings after every losing signal.
- Constant adjustment can lead to overfitting, where the indicator looks effective on historical data but becomes unreliable when conditions change.
- Traders can also misread channel expansion. A wider channel means volatility has increased; it does not tell traders whether price must rise or fall. Direction still needs to be evaluated using the EMA slope, price position, and market structure.
- Using the indicator without broader support and resistance can also reduce context.
- A breakout above the upper band directly into a major resistance zone may deserve a different interpretation from a breakout into open price space.
- Most importantly, the Keltner Channel Indicator cannot predict future prices. It helps organize current and historical price information, but every trading setup remains uncertain.
Risk Management With Keltner Channels
Risk management remains important when using any technical analysis tool. Keltner Channels can help traders understand volatility, but they do not decide how much capital should be exposed to a position.
Position size, available capital, stop distance, market volatility, leverage, and personal risk tolerance all affect the risk of a trade. Some traders use percentage-based position sizing or risk-to-reward frameworks, but these are strategy choices rather than universal rules.
ATR can also provide useful context because it reflects recent price movement. A market with a higher ATR may require more room for normal fluctuations than one with a lower ATR. However, increasing stop distance without adjusting position size can increase overall exposure.
Leverage can amplify both gains and losses, and available leverage may differ by instrument, account type, broker, and jurisdiction. Traders should understand the conditions that apply to their own account.
For Evest readers, the main point is that technical analysis should support a structured process. Keltner Channels can help define context, but they cannot remove uncertainty, guarantee a result, or replace responsible risk management.
FAQs
What is the best Keltner Channel setting for trading?
There is no universal best setting. A 20-period EMA with a 2 ATR multiplier is commonly used, but suitable parameters depend on the market, timeframe, volatility, and strategy. Traders should test settings across different conditions before relying on them consistently.
How do traders use the Keltner Channel for breakouts?
Traders often watch for price to close beyond an outer band after consolidation or reduced volatility. They may then compare the move with support, resistance, momentum, volume, or a retest before deciding whether the breakout has sufficient confirmation for analysis.
Is the Keltner Channel better than Bollinger Bands?
Neither indicator is universally better. Keltner Channels use ATR to measure volatility, while Bollinger Bands use standard deviation. Keltner Channels may appear smoother, while Bollinger Bands can react more sharply to price dispersion. The choice depends on strategy and context.
Can the Keltner Channel identify overbought or oversold markets?
Outer-band touches can highlight unusually strong price movement, but they do not automatically mean a market is overbought or oversold. During strong trends, price may remain near one band for extended periods, so market context is needed before drawing conclusions.
Can beginners use the Keltner Channel Indicator?
Yes, beginners can use it to study trend direction and volatility, but they should first understand EMA, ATR, support, resistance, and risk management. The indicator is easier to interpret when traders avoid treating band touches as an automatic trading signal.