
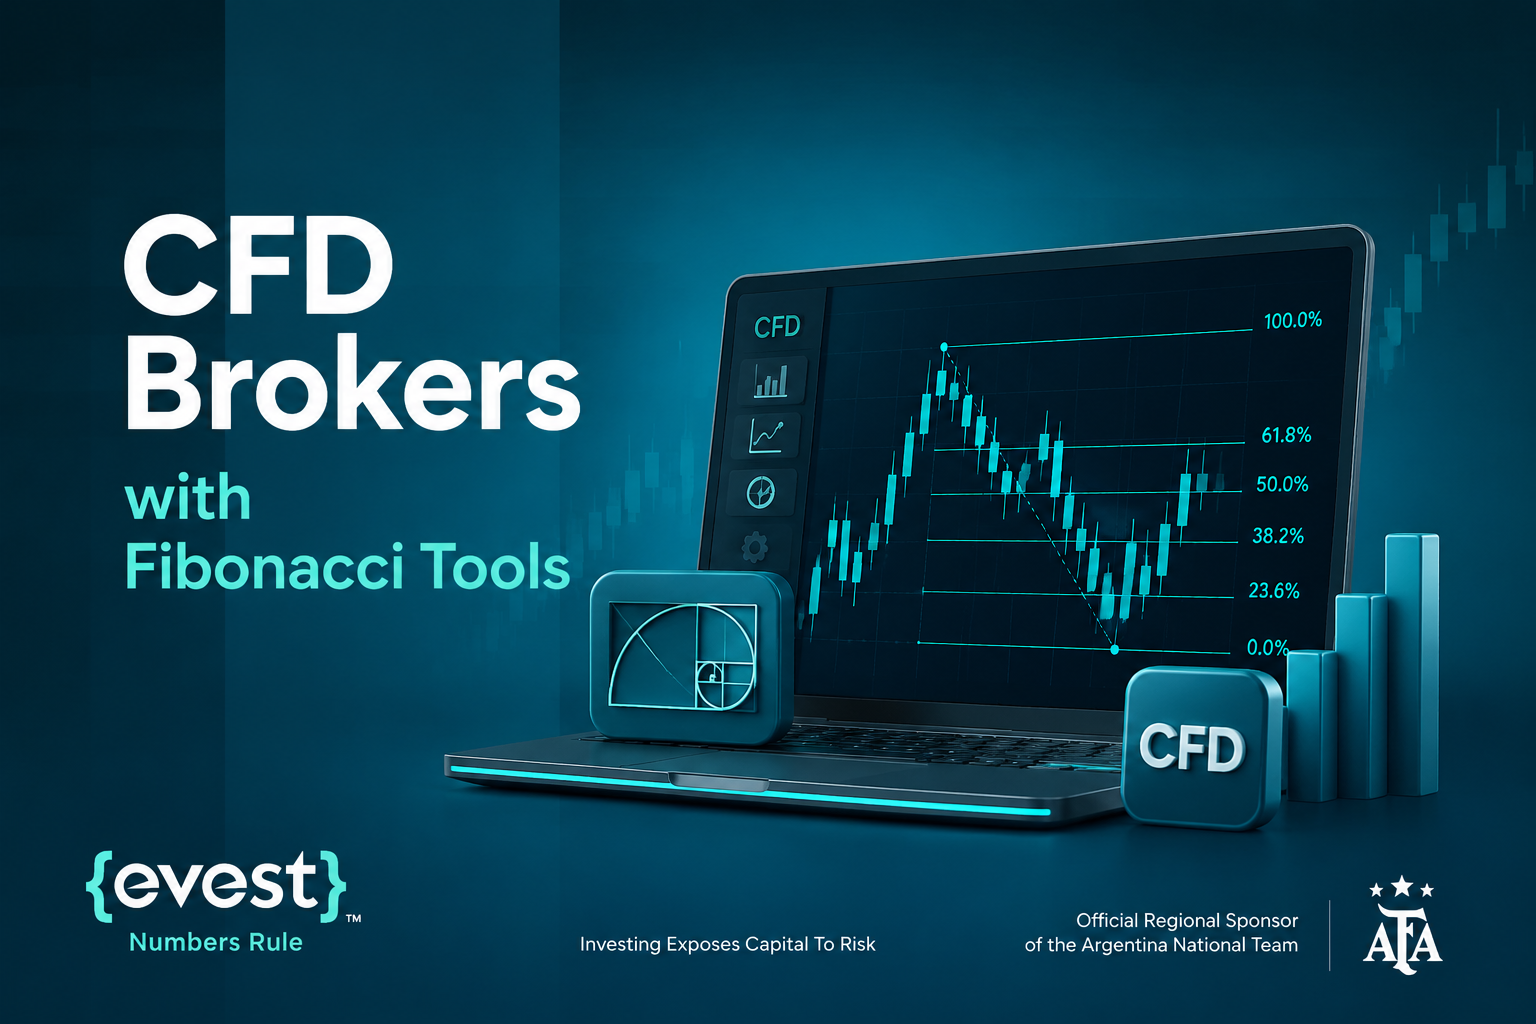
Traders across the GCC increasingly filter their broker shortlist by one specific requirement: charting quality. That is why CFD brokers with Fibonacci tools have become a distinct search category rather than a niche preference. Fibonacci levels do not predict the market; they map price zones where a reaction becomes statistically more likely. The value of those levels depends entirely on the platform drawing them, its data accuracy, timeframe range, and execution speed. This guide covers the tool set, the evaluation criteria, the practical workflow, and the trading conditions available on the Evest platform.
What Fibonacci Tools Are and Why They Matter in CFD Trading?
Before assessing platforms, it helps to understand both the mathematical basis and the behavioural logic behind these tools, because that distinction separates systematic use from guesswork.
The origin of Fibonacci ratios
Fibonacci ratios derive from a numerical sequence in which each number is the sum of the two preceding it. Dividing terms of that sequence produces a set of near-constant ratios, most commonly 23.6%, 38.2%, 50%, 61.8%, and 78.6%. The 61.8% level is known as the Golden Ratio and is the most widely watched of the group.
The 50% level is not mathematically a Fibonacci ratio, but it is included in the tool because it marks the midpoint of a price move, a zone a large number of market participants monitor.
Why they suit CFDs specifically?
CFD trading is speculation on price movement in either direction without ownership of the underlying asset. Entry and exit points are therefore the entire substance of the trade, and any improvement in locating them feeds directly into risk management.
CFDs are also traded on margin, which makes disciplined stop-loss and take-profit placement more important than in unleveraged markets. Fibonacci tools provide an objective framework for setting those levels instead of relying on subjective estimation.
Methodological note: Fibonacci levels are probabilistic, not confirmed signals. They should never be read in isolation from the prevailing trend or from independent confirmation.
The Fibonacci Tool Set to Look For in Any CFD Platform
When assessing CFD brokers with charting tools, a single item labelled “Fibonacci” is not sufficient. A complete set covering both price and time analysis is the realistic benchmark, and the tools below define it.
Fibonacci Retracement
The most widely used tool of the group. Drawn between a swing low and a swing high, it maps the levels at which a corrective move may stall before the original trend resumes. Its primary use is locating entries in the direction of the dominant trend.
Fibonacci Extension
The inverse function of retracement. Rather than mapping where a correction stops, it projects how far price may travel once the trend resumes, commonly at 127.2%, 161.8%, and 261.8%. It is used mainly to define exit targets.
Fibonacci Fan
A set of diagonal lines drawn from a pivot point at angles derived from Fibonacci ratios. It identifies dynamic support and resistance that shifts with time, which suits extended, well-defined trends.
Fibonacci Arcs
Semi-circular curves that combine the price and time dimensions in a single overlay. They indicate zones where price may meet resistance or support as time passes, rather than at a fixed horizontal level.
Fibonacci Time Zones
Vertical lines dividing the time axis according to the Fibonacci sequence. They do not forecast price; they highlight time windows in which a change in price behaviour becomes more probable, useful on higher timeframes.
Fibonacci Channel
Similar to the Fan, but drawn as parallel channels following the slope of the trend. It helps track the range of movement within a defined trend and identify its upper and lower boundaries.
How to Evaluate the Best CFD Brokers for Technical Analysis?
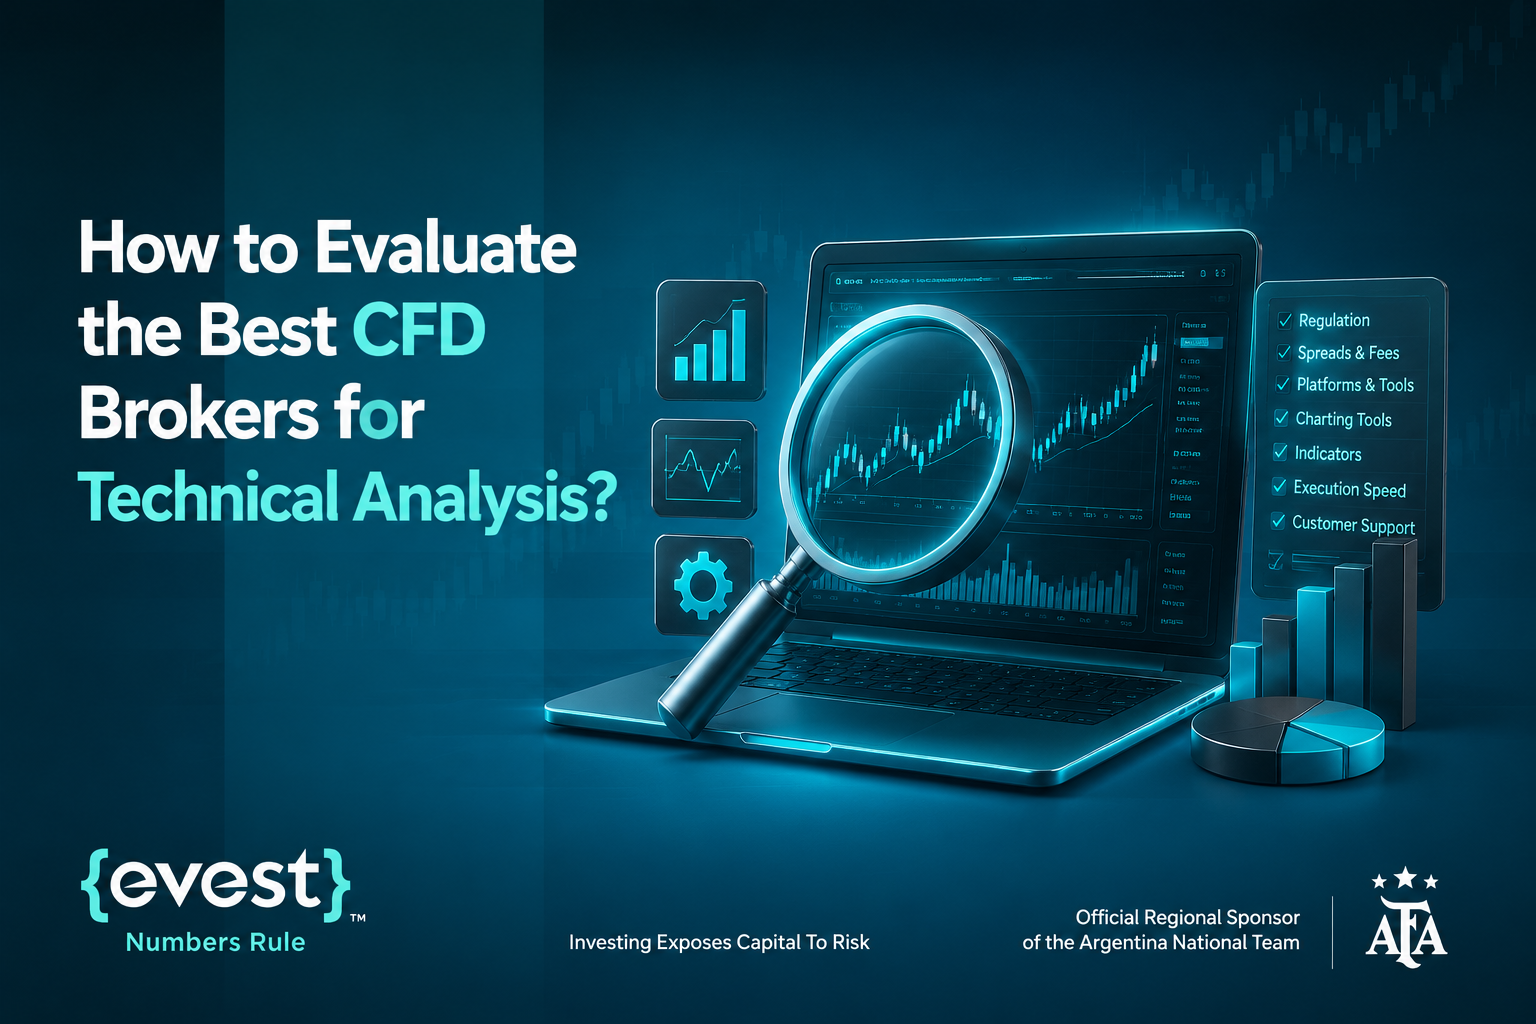
The tool alone means little; the environment it operates in determines its practical value. The criteria below form a working framework for assessing CFD trading platforms from an analyst’s perspective.
| Criterion | Why it matters to a Fibonacci trader |
| Regulation and licensing | Defines the client-fund protection framework and operational transparency |
| Price data quality | Levels drawn on incomplete data produce misleading zones |
| Timeframe range | Allows level confirmation across multiple horizons |
| Execution speed | Levels break quickly; latency changes the effective entry |
| Instrument coverage | Lets one methodology be applied across several asset classes |
| Cost transparency | Spreads and swaps directly affect the viability of shorter trades |
| Risk management tools | Stop-loss and Take Profit orders anchored to technical levels |
| Demo account | Strategy testing before capital is committed |
| Educational content | Shortens the learning curve for newer traders |
| Arabic-language support | Essential for traders across the GCC markets |
Taken together, these criteria are what should drive the search for the best CFD brokers in 2026, rather than promotional rankings alone.
Using Fibonacci Tools in Practice
Correct application follows a fixed sequence, and skipping any step measurably weakens the reliability of the analysis.
Step one: establish the trend first
Fibonacci is a trend-dependent tool, not a substitute for trend identification. Define the prevailing direction on a timeframe higher than the one you trade, then look for corrective entries in the direction of that move.
Step two: anchor the drawing correctly
In an uptrend, the tool is drawn from swing low to swing high; in a downtrend, from high to low. The anchor points must be clear, confirmed swing extremes, not arbitrary fluctuations inside a narrow range.
Step three: wait for confirmation
A Fibonacci level is not an entry signal in itself. Look for confluence with other elements: a prior horizontal support or resistance, a reversal candlestick pattern, or a key moving average. Multiple elements converging on the same zone raise the quality of the setup.
Step four: anchor ris
k management to the levels
Place the stop-loss beyond the next Fibonacci level rather than directly on it, to avoid being closed out by a brief overshoot. Set Take Profit at extension levels, and calculate the risk-to-reward ratio before entering rather than after.
Reminder: leveraged CFD trading carries a high level of risk. Review the full risk warning in the site footer before making any trading decision.
Fibonacci Strategy by Asset Class
Application varies with the nature of the instrument, its volatility profile, and the leverage terms attached to it.
Forex
Trades 24 hours a day across the Asian, European, and US sessions during the trading week. Fibonacci levels tend to perform well on major pairs given their liquidity depth. Leverage on forex at Evest reaches up to 1:400.
Stocks
Analysis here is affected by company-specific announcements and reporting periods, so higher timeframes are generally preferable. Leverage on stocks is 1:5, reflecting the different volatility profile of individual equities. Evest applies 0% commission on stock trades.
Indices and Commodities
Indices reflect a basket of companies, which tends to make their technical levels more stable than those of a single stock. Commodities such as gold respond directly to US dollar movement and macroeconomic data. Leverage on indices and commodities reaches up to 1:100.
Cryptocurrencies
A high-volatility class, which means retracement levels are broken more frequently and more sharply. Wider stop placement and reduced position sizing are the standard adjustments. Leverage on cryptocurrencies is 1:2.
Evest Investment Baskets (EIBs)
A product combining several instruments into a single basket, suited to a longer-horizon approach that is less sensitive to intraday noise. Leverage on investment baskets is 1:10.
Common Mistakes with Fibonacci Tools
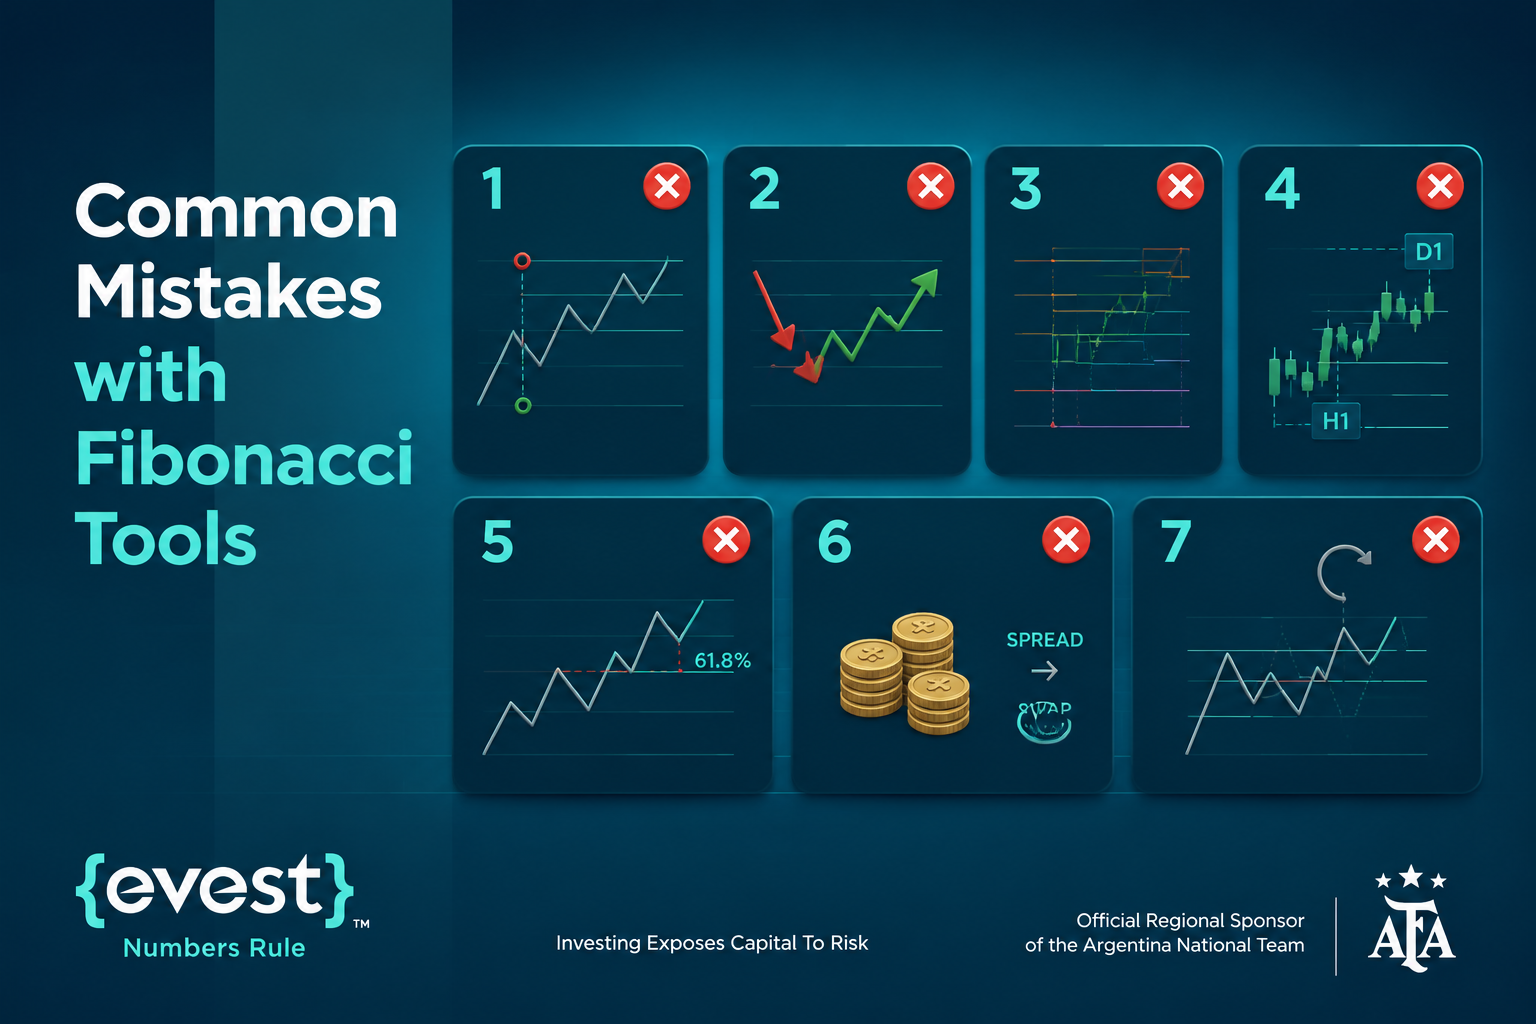
These errors are the most frequent reason traders conclude that the tool “does not work”.
- Anchoring to unclear swing points: an arbitrary high or low produces levels with no analytical meaning.
- Using Fibonacci against the trend: the tool works with the dominant direction, not against it.
- Overlaying multiple drawings at once: produces contradictory readings and decision paralysis.
- Ignoring the higher timeframe: a strong level on the hourly chart may carry no weight on the daily.
- Placing the stop directly on the level: exposes the position to closure on a brief overshoot.
- Disregarding costs: spreads and overnight swaps affect the viability of frequent short-duration trades.
- Redrawing after the setup fails: adjusting analysis to match price removes any predictive value it had.
Evest: Platform, Analysis Tools and Trading Conditions
Having set out the criteria, this section applies them to the Evest platform and what it offers traders who work primarily from technical analysis.
Technical analysis and market insights
Evest provides Trading Central, a licensed third-party provider delivering technical-analysis-based insights and market commentary in real time. These insights function as an additional confirmation layer alongside a trader’s own analysis, not as a replacement for it.
Evest Analytics and TipRanks
Evest Analytics applies artificial intelligence to convert complex equity data into simplified, readable output. The TipRanks stock research tool is also available, which suits traders combining technical and fundamental inputs in the same decision.
Instrument range and execution
The platform covers more than 400 financial instruments across forex, stocks, indices, commodities, cryptocurrencies, and investment baskets. Execution speed is 0.03ms, which matters when trading around sensitive technical levels. Deposits carry no fees.
Demo account and Trading Academy
The demo account provides $25,000 in virtual funds for testing Fibonacci strategies without exposing capital. The Trading Academy offers structured educational content spanning beginner fundamentals through to advanced strategy.
Evest Trading Account Types
Live accounts are tiered by deposit level, and the differences affect trading costs and the depth of support a trader receives, both relevant when running a technical strategy.
Silver $250 to $4,999
Entry-level account giving full access to the instrument range and the platform’s charting environment. Includes daily market summaries and analysis, making it a practical starting point for traders new to CFD trading.
Gold $5,000 to $19,999
Mid-tier account with tighter spreads than Silver, which improves cost efficiency for more frequent trading. Adds a dedicated account manager alongside continued access to market analysis and summaries.
Platinum $20,000 to $49,999
Designed for traders running larger positions, with spreads narrower than the Gold tier. Adds senior account management support and access to the Trading Central analysis suite.
Diamond $50,000 and above
The highest tier, aimed at experienced traders managing substantial capital, with the platform’s tightest spread conditions. Includes senior account management, Trading Central access, and preferential withdrawal terms.
Islamic Trading Account
A fully interest-free account structure aligned with Sharia principles, available across tiers. Covers Sharia-compliant equities and applies no overnight swap charges during the initial holding period.
Demo Account
A risk-free environment funded with $25,000 in virtual capital, mirroring live market conditions. Suited to testing Fibonacci setups and validating a strategy before committing real funds.
Best CFD Brokers for Beginners: Where to Start with Fibonacci
A newer trader does not need to master all six tools at once; a staged progression works considerably better.
- Start with one tool: Fibonacci Retracement only, on a single timeframe.
- Practise on the demo account: apply the method on virtual funds until results stabilise.
- Document every trade: record the reasoning for entry and exit so performance can be reviewed objectively.
- Add one confirmation tool: a horizontal level or a moving average, nothing more at this stage.
- Expand gradually: introduce extensions and exit targets only once entries are consistent.
- Prioritise risk management: position sizing matters more than the precision of any single level.
The move to a live account should follow sustained demo performance rather than a single strong week. Full platform and account details are available on the Evest website.
Choosing among the best CFD brokers with Fibonacci tools is not a question of whether the drawing tool exists. It is a question of the surrounding system: accurate price data, a broad timeframe range, fast execution, instrument coverage, and risk management tools that anchor directly to technical levels. As the best CFD trading platforms continue to develop through 2026, the differentiator is how well the analysis toolkit integrates with the execution environment, the educational resources, and localised support.
Fibonacci tools remain probabilistic instruments used within a defined risk management plan; they do not guarantee any outcome. Review the full risk warning available in the site footer before making any trading decision.
FAQs
Do Fibonacci tools work on all financial instruments?
Fibonacci tools can be applied to forex, stocks, indices, commodities and cryptocurrencies alike. Their effectiveness varies with the liquidity and volatility profile of the instrument. Highly liquid assets generally produce clearer levels that the market respects more consistently.
What is the difference between Fibonacci Retracement and Extension?
Retracement identifies zones where a counter-move may pause before the original trend resumes. Extension projects the levels price may reach after the trend resumes and clears the prior high or low. In practice: retracement is used for entries, extension for exit targets.
Do I need prior experience to use Fibonacci tools?
No advanced experience is required to begin, but a working grasp of trend, support, and resistance is. Practising on the demo account with virtual funds before committing real capital is strongly advised. The Trading Academy covers these fundamentals in a structured, step-by-step format.
What is the best timeframe for Fibonacci analysis?
There is no single correct timeframe; the choice follows your trading style and holding period. Higher timeframes such as the daily and four-hour produce more reliable levels and fewer signals. The practical rule is to establish the trend on a higher timeframe, then locate the entry on a lower one.
Why does price sometimes ignore Fibonacci levels?
Because these levels are probabilistic zones rather than fixed barriers to price movement. Strong economic data or an abrupt shift in market direction will see levels broken without reaction. This is precisely why independent confirmation is required before acting on any level.
How do I use Fibonacci levels to set a stop-loss?
Place the stop beyond the next Fibonacci level below or above your entry, never directly on the level itself. That additional distance reduces the chance of being closed out by a brief intraday overshoot. Position size should then be calculated from the stop distance, not the other way round.