
Trading CFDs is highly speculative and carries a high level of risk. The information in this article is for educational purposes only and does not take into account your individual objectives, financial situation, or needs. The TRIX indicator is a momentum oscillator indicator designed to help traders evaluate trend direction and changes in momentum while filtering short-term price noise. It measures the rate of change of a triple exponentially smoothed moving average, making it useful for analyzing zero-line crossovers, TRIX divergence, and shifts in market momentum. Rather than treating TRIX as a standalone buy-or-sell tool, traders can use it as part of a broader technical analysis process. In this Evest guide, we explain how the indicator works, the TRIX indicator formula, common trading signals, TRIX indicator settings, and how it can be used within an MT5 trading environment.
Defining the Triple Exponential Average
The triple exponential average is the foundation of the TRIX calculation. It is created by applying an Exponential Moving Average (EMA) three times in succession.
The first EMA smooths the original price data. The second EMA smooths the first EMA, and the third EMA smooths the second EMA. This triple-smoothing process helps filter short-term fluctuations so the indicator can focus more clearly on the underlying movement in momentum.
Because TRIX is calculated from smoothed historical price data, traders should still interpret its readings alongside current price action and market conditions rather than viewing them as predictive signals.
The Core Concept of TRIX as a Momentum Oscillator
TRIX measures the rate of change of the third EMA rather than price direction alone. A reading above zero generally means the triple-smoothed average is rising, which reflects positive momentum. A reading below zero means it is falling, which reflects negative momentum.
The slope also matters. A rising TRIX line can indicate improving momentum even while the indicator remains below zero. Likewise, a falling line can indicate weakening momentum even when TRIX is still above zero.
For this reason, traders usually assess both the position of the line relative to zero and the direction in which the indicator is moving.
The Mathematical Foundation: TRIX Indicator Calculation Explained
Understanding how the TRIX indicator is calculated can make its signals easier to interpret. The calculation has two main stages: creating a triple-smoothed EMA and then measuring the change in that final EMA.
Step-by-Step Breakdown of the Triple Exponential Moving Average
The process can be summarized in three smoothing steps:
- EMA1: Calculate an EMA of the selected price series for a chosen period.
- EMA2: Calculate an EMA of the EMA1 values using the same period.
- EMA3: Calculate another EMA of the EMA2 values.
The final EMA3 series is then used to calculate TRIX.
TRIX Indicator Formula
The TRIX indicator formula measures the one-period rate of change of the third EMA:
TRIX = (EMA3 current − EMA3 previous) / EMA3 previous
Depending on the platform or indicator implementation, the result may also be displayed as a percentage. The core TRIX calculation applies three consecutive EMA smoothing stages before measuring the change in the final EMA.
A positive value means the triple-smoothed EMA is rising relative to the previous period, while a negative value means it is falling. This explains why TRIX behaves as both a trend-following and momentum-based oscillator.
TRIX Crossover Strategy: How to Read Zero-Line Crossings
One of the simplest ways to interpret the TRIX indicator is through the zero line.
- Above zero: Momentum is generally positive.
- Below zero: Momentum is generally negative.
- Cross above zero: Momentum has shifted from negative to positive.
- Cross below zero: Momentum has shifted from positive to negative.
A TRIX crossover strategy can use these changes as confirmation rather than automatic trade instructions. For example, a move above zero may support a bullish scenario when price structure is also improving, while a move below zero may support a bearish view when price action confirms weakness.
Zero-line crossings are among the standard signals associated with TRIX, alongside reversals in the oscillator and divergence between TRIX and price.
A zero-line crossover does not guarantee that a new trend will continue. In sideways markets, repeated crossings can create false signals, so market context remains important.
TRIX Indicator Strategy: How to Use TRIX in Trading?
A TRIX indicator strategy can combine several types of information from the oscillator: the zero line, line direction, crossovers, divergence, and momentum changes.
The strongest use case is not to depend on one signal, but to ask whether TRIX supports what price action is already showing.
Identifying Trend Direction and Potential Reversals with TRIX
When TRIX stays above zero and continues rising, it suggests that positive momentum is being maintained. When it remains below zero and continues falling, negative momentum is dominant.
Changes in slope can provide additional information. For example, if TRIX is still below zero but begins to rise consistently, bearish momentum may be weakening. That does not automatically mean an uptrend has started, but it can alert traders to a change in momentum.
Potential reversals can also be studied through peaks, troughs, and divergence between price and TRIX.
Using TRIX for Overbought and Oversold Conditions
The TRIX indicator can also be used to observe unusually high or low momentum readings, but it does not operate within a fixed range such as RSI.
There is no universal TRIX level that always means overbought or oversold. An extreme value should be evaluated relative to the historical behavior of the same asset and timeframe.
For example, a reading that is unusually high on one market may be normal on another. Traders can therefore compare current readings with previous TRIX peaks and troughs instead of relying on one fixed threshold.
Generating Signals with TRIX Divergence
TRIX divergence occurs when price and momentum move in different directions.
- Bullish divergence: Price forms a lower low while TRIX forms a higher low. This may indicate that selling momentum is weakening.
- Bearish divergence: Price forms a higher high while TRIX forms a lower high. This may indicate that buying momentum is weakening.
Divergence should be treated as a warning of changing momentum rather than proof that a reversal will occur. TRIX documentation also identifies bullish and bearish divergence as potential oscillator signals based on the relationship between price peaks or troughs and the indicator.
For example, if price reaches a new high while TRIX fails to confirm that high, the existing trend may be losing strength. Traders can then look for additional confirmation from support and resistance, candlestick structure, or another independent analytical tool.
Advanced TRIX Indicator Applications and Customizations
The TRIX indicator can be adapted to different trading styles by adjusting its settings and combining it with complementary forms of technical analysis.
Combining TRIX with Other Technical Indicators
Using several indicators does not automatically improve a strategy. The goal is to combine tools that provide different types of information.
- TRIX and Bollinger Bands: Bollinger Bands can provide volatility and price-location context while TRIX measures momentum. A price breakout accompanied by improving TRIX momentum may provide more context than either signal alone.
- TRIX and RSI: RSI measures the speed and magnitude of recent price changes, while TRIX focuses on the rate of change of a triple-smoothed EMA. Traders may compare both indicators to see whether momentum conditions support the same market interpretation.
- TRIX and MACD: Both indicators use moving-average-based calculations, so agreement between them can provide additional context but should not be treated as fully independent confirmation. Simultaneous bullish or bearish signals do not guarantee a successful trade.
- TRIX and Volume: Volume can help assess participation behind a move. For exchange-traded instruments, traders can compare TRIX signals with reported trading volume. In decentralized markets such as spot forex, available data may represent tick volume or volume from a particular venue, so it should be interpreted accordingly.
TRIX Indicator Settings: Best TRIX Settings for Day Trading and Longer Timeframes
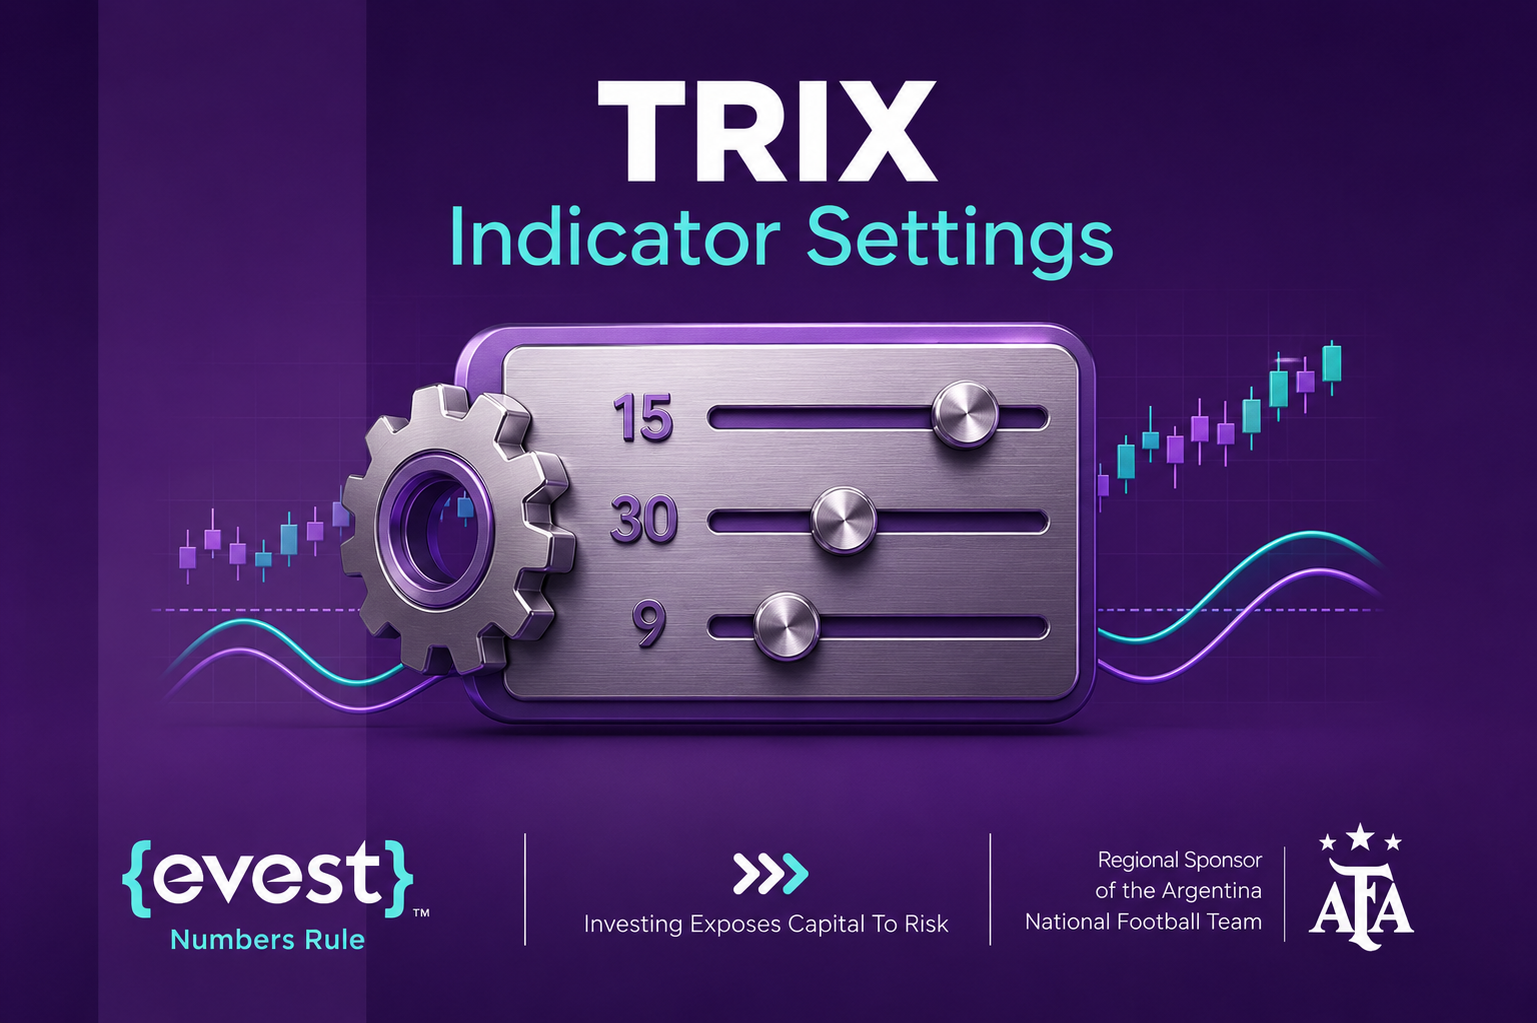
TRIX indicator settings determine how quickly the oscillator reacts to changing prices.
Shorter periods make TRIX more sensitive and responsive, but they can also increase short-lived or false signals. Longer periods create smoother readings and may help filter more noise, although signals can appear later.
A period around 15 is commonly used as a starting point for TRIX, but it should not be treated as a universal setting. MetaTrader-related documentation and examples also use 15 as a common TRIX period while allowing the period to be adjusted.
Best TRIX Settings for Day Trading
Traders looking for the best TRIX settings for day trading may test shorter periods, such as 9 or 12, because they respond more quickly to intraday momentum changes.
However, the best setting depends on the instrument, timeframe, volatility, and confirmation rules used in the strategy. A setting that appears effective on one market may perform differently on another.
For swing trading or longer timeframes, traders may test longer periods to reduce sensitivity to short-term noise. Historical testing can help compare how different parameters behave, but over-optimizing settings to past data can produce misleading results.
Understanding the TRIX Signal Line and Histogram
Some TRIX implementations include a signal line and histogram in addition to the main oscillator.
A signal line is usually a moving average of the TRIX line. When TRIX crosses above its signal line, momentum is strengthening relative to that average; a cross below can indicate weakening momentum.
A histogram typically shows the difference between TRIX and its signal line. An expanding histogram can indicate increasing separation between the two lines, while a contracting histogram can signal that momentum is slowing.
These tools can make changes in momentum easier to visualize, but their exact construction can vary by platform or indicator version.
TRIX Indicator MT5: Using TRIX with Evest
For traders using Evest, MetaTrader 5 can be part of the technical-analysis workflow. Evest currently provides access to MT5.
When working with a TRIX indicator MT5 setup, traders can select the market and timeframe they want to analyze, add an appropriate TRIX indicator implementation to their charting setup, and then evaluate its behavior alongside price.
A practical workflow can include:
- Select the asset and timeframe.
- Apply TRIX and choose a period appropriate to the trading style.
- Check whether TRIX is above or below zero.
- Observe whether momentum is rising or falling.
- Look for zero-line crossovers or TRIX divergence.
- Confirm the signal with price structure or another analytical tool.
- Apply risk-management rules before acting on any trading idea.
The purpose of using TRIX with an Evest MT5 workflow is not to generate guaranteed trading decisions. It is to organize momentum analysis within a broader decision-making process.
Advantages and Limitations of the TRIX Indicator
Like any technical-analysis tool, the TRIX indicator has strengths and limitations.
Benefits of Using TRIX for Smoothed Price Action Analysis
- Noise filtering: Triple EMA smoothing helps reduce the effect of short-term price fluctuations.
- Momentum analysis: The zero line and slope make it easier to evaluate whether momentum is positive, negative, strengthening, or weakening.
- Divergence analysis: TRIX can highlight situations where price and momentum are no longer confirming each other.
- Flexible application: The indicator can be analyzed across different markets and timeframes, although settings and behavior can vary.
Potential Drawbacks and Lagging Nature of TRIX
- Lag: Because the calculation uses several layers of historical price smoothing, some signals may appear after a price move has already started.
- False signals in sideways markets: Repeated changes around the zero line can create whipsaws when there is no clear trend.
- Over-smoothing: Smoothing can remove useful short-term information for traders who rely on very fast price movements.
- No price prediction: TRIX describes momentum based on historical price data; it cannot guarantee future market direction.
Common Mistakes to Avoid When Trading with TRIX

- Using TRIX in isolation: No single indicator provides complete market context. Confirmation from price action, support and resistance, or another suitable tool can improve analysis.
- Treating every crossover as a trade: A crossover is an analytical signal, not an automatic instruction.
- Ignoring market conditions: TRIX tends to be easier to interpret when markets trend clearly than when price is moving sideways.
- Over-optimizing settings: A parameter that works perfectly on historical data may not behave the same way in future conditions.
- Misreading divergence: Divergence may signal weakening momentum without producing an immediate reversal.
- Ignoring risk management: Stop Loss, Take Profit, position sizing, and capital management remain important regardless of the indicator being used.
FAQs
What is the main purpose of the TRIX indicator?
The TRIX indicator is used to analyze trend direction and momentum by measuring the rate of change of a triple-smoothed EMA. It can also help traders identify zero-line crossovers and divergence.
Is TRIX a momentum oscillator indicator?
Yes. TRIX is a momentum oscillator indicator because it measures changes in the triple-smoothed EMA rather than displaying the moving average itself.
How is the TRIX indicator different from RSI or MACD?
TRIX uses three consecutive EMA smoothing stages before calculating the rate of change. RSI uses a different momentum calculation, while MACD measures the relationship between moving averages. Each indicator therefore presents momentum from a different perspective.
What are the best TRIX indicator settings?
There is no single best setting for every market. Shorter periods are more sensitive, while longer periods create smoother signals. The appropriate TRIX indicator settings depend on the asset, timeframe, volatility, and trading method.
Can the TRIX indicator be used for day trading?
Yes, TRIX can be analyzed on intraday charts. Traders often test shorter periods for faster responsiveness, but shorter settings can also generate more noise and false signals.
Does TRIX divergence guarantee a reversal?
No. TRIX divergence indicates that price and momentum are no longer moving in the same direction. It can warn that a trend is weakening, but additional confirmation is needed.
Can TRIX be used on Evest MT5?
Evest currently provides access to MetaTrader 5. Traders who want to incorporate the TRIX indicator into an MT5 workflow can use an appropriate TRIX implementation alongside price analysis and risk-management rules.