
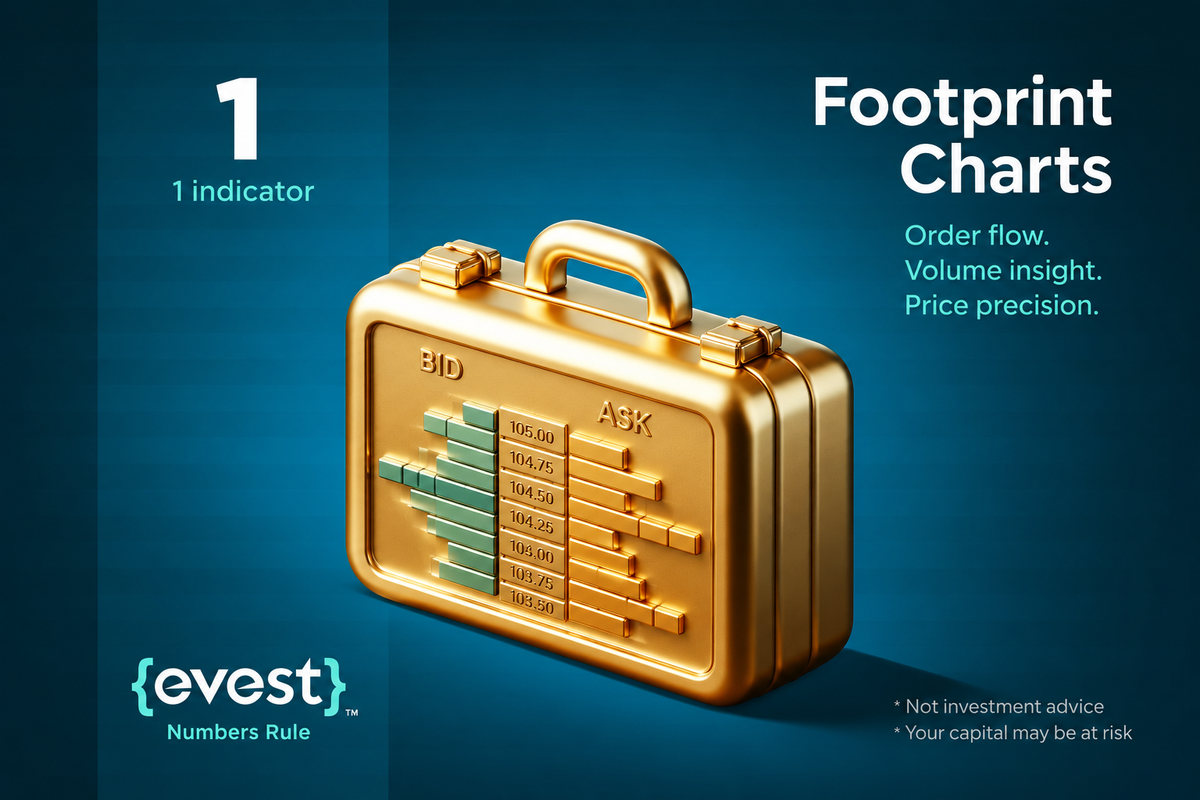
Footprint Charts can help traders analyze executed volume and order flow in more detail than traditional price charts. Instead of showing only open, high, low, and close prices, they display how much volume traded at specific price levels inside each bar.
This makes them useful for traders who want to study buyer and seller aggression, imbalances, absorption, exhaustion, and areas where significant trading activity occurred. However, Footprint Charts do not predict price direction on their own, and they do not guarantee accurate entries or exits.
Their usefulness depends heavily on data quality, market structure, platform settings, and the trader’s ability to interpret order flow within a broader context.
What Are Footprint Charts?
Footprint Charts are order flow charts that show executed trading volume at each price level within a selected bar or session.
A traditional candlestick shows where price opened, moved, and closed. A Footprint Chart goes deeper by showing how much volume traded at each price and, depending on the platform, how much of that volume was executed at the bid or the ask.
This helps traders understand not only where price moved, but also how trading activity was distributed inside the move.
Footprint Charts are most reliable in exchange-traded markets with centralized tick data, such as many futures markets. In CFDs, spot forex, or some crypto markets, volume data may depend on the broker, exchange, or data provider.
Footprint Charts vs. Candlestick Charts
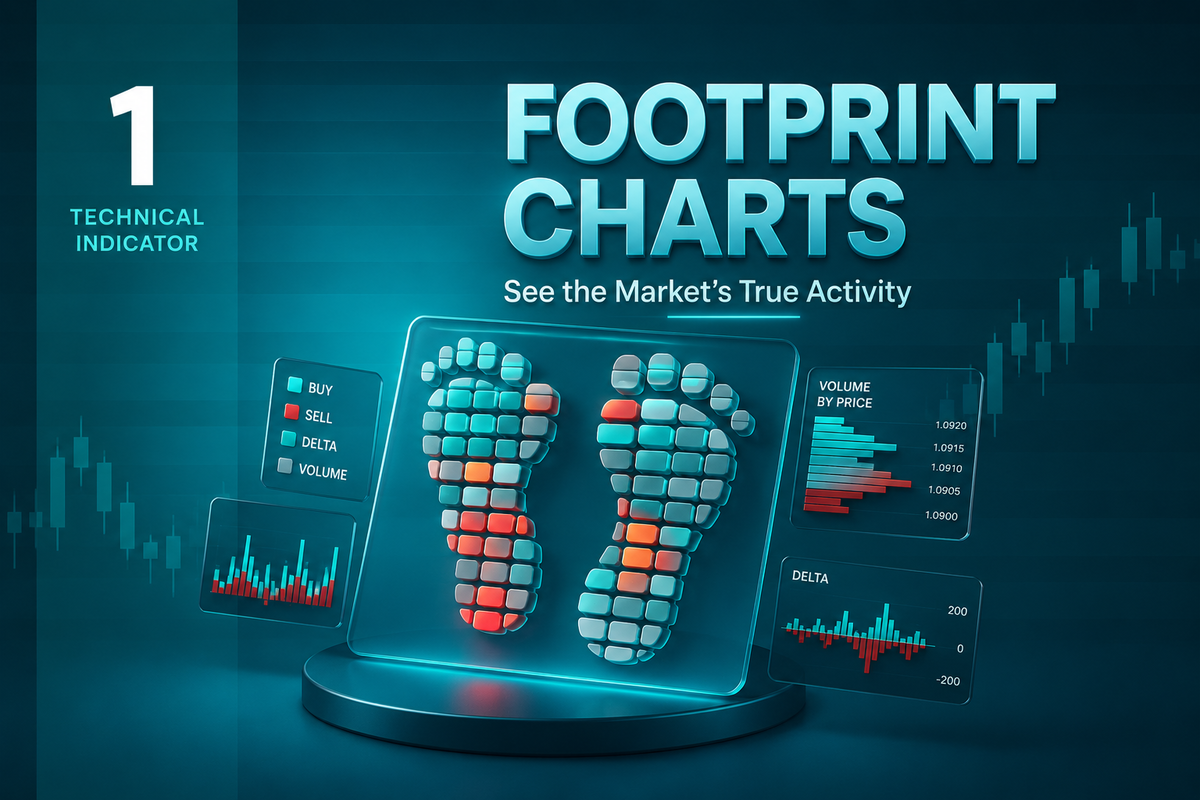
Candlestick charts remain useful for understanding trend, structure, volatility, and price action. Footprint Charts add execution-level detail.
| Feature | Candlestick Charts | Footprint Charts |
| Main data shown | Open, high, low, close | Executed volume at price levels |
| Main focus | Price structure and patterns | Order flow and volume interaction |
| Detail level | Summary of price movement | Internal activity inside each bar |
| Learning curve | Easier for beginners | More advanced and data-dense |
| Best use | Trend, structure, support/resistance | Volume, delta, imbalance, absorption |
A candlestick may show a strong bullish close. A Footprint Chart may show whether that move had strong aggressive buying, whether buying was absorbed, or whether the volume was concentrated at specific price levels.
This does not make one chart better than the other. They answer different questions.
Footprint Charts vs. DOM and Volume Profile
Footprint Charts, Depth of Market, and Volume Profile are related order flow tools, but they are not the same.
| Tool | What It Shows | Main Limitation |
| DOM | Resting bid and ask liquidity | Orders can be pulled or changed |
| Volume Profile | Total volume by price over a period | Does not always show bar-by-bar execution sequence |
| Footprint Chart | Executed volume inside each bar | Requires reliable tick data and careful interpretation |
- Depth of Market: DOM shows resting bid and ask orders waiting to be filled. However, resting orders can be added, removed, or changed quickly, so DOM liquidity should not be treated as guaranteed.
- Volume Profile: Volume Profile shows where total volume traded over a selected period. It highlights high-volume and low-volume areas, but it does not always show the sequence of execution inside each bar.
- Footprint Charts: Footprint Charts show executed volume inside the bar and may separate aggressive buying from aggressive selling.
Used together, these tools can help traders understand liquidity, executed volume, and price behavior more clearly.
Key Components of Footprint Charts
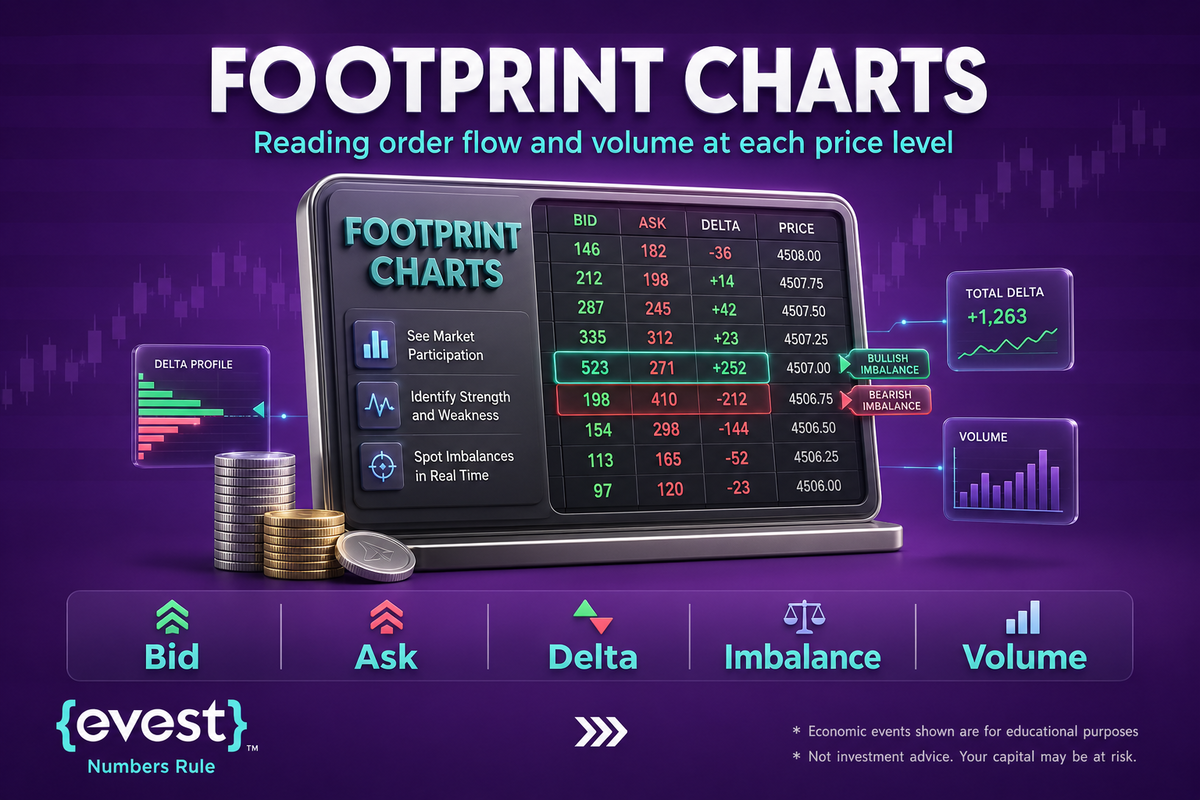
Footprint Charts usually include bid volume, ask volume, delta, imbalances, and Point of Control.
- Bid volume: Generally represents aggressive selling executed at the bid.
- Ask volume: Generally represents aggressive buying executed at the ask.
- Delta: Shows the difference between ask volume and bid volume.
- Positive delta: Means aggressive buying dominated during that bar or price level.
- Negative delta: Means aggressive selling dominated during that bar or price level.
- Important limitation: Delta does not show the full intentions of all market participants.
Delta = Ask Volume – Bid Volume
A positive delta does not guarantee that price will rise. Strong passive selling may absorb aggressive buying. A negative delta does not guarantee that price will fall. Strong passive buying may absorb aggressive selling.
Point of Control and High-Volume Areas
The Point of Control, or POC, is the price level where the highest volume traded within the selected bar or profile.
It should be treated as a high-volume reference area, not guaranteed fair value. Price may react around a POC because a lot of trading occurred there, but it can also pass through it without a meaningful reaction.
High-volume areas may show agreement, disagreement, absorption, or liquidity concentration. Context decides what the level means.
Traders often monitor POC levels with market structure, support and resistance, volume behavior, and session context.
Imbalances in Footprint Charts
An imbalance occurs when aggressive volume on one side is much larger than the opposite side at nearby price levels.
- Buy imbalance: Appears when aggressive buying at the ask is much greater than aggressive selling at the bid.
- Sell imbalance: Appears when aggressive selling is much greater than aggressive buying.
- Stacked imbalances: Occur when multiple consecutive price levels show imbalance in the same direction.
- Context matters: Stacked imbalances may support continuation if confirmed by context, liquidity, and follow-through.
- False signals can happen: A strong imbalance in the wrong location or against a larger trend can become a trap rather than a signal.
- Thresholds vary: Suitable imbalance filters depend on the market, timeframe, platform, and liquidity conditions.
Absorption and Exhaustion
Absorption happens when aggressive orders hit the market but price does not continue in the expected direction.
For example, if aggressive buyers continue lifting the ask but price fails to move higher, passive sellers may be absorbing the buying pressure. If aggressive sellers keep hitting the bid but price does not move lower, passive buyers may be absorbing selling pressure.
Exhaustion appears when aggressive volume weakens near a price extreme. This may suggest that the dominant side is losing strength.
Both patterns are easier to identify in hindsight than in live trading. Live interpretation requires practice, confirmation, and broader market context.
Unfinished Auctions
- An unfinished auction occurs when a price level shows incomplete two-sided activity at an extreme, depending on how the platform defines and displays it.
- Some traders monitor unfinished auctions as possible revisit areas. The idea is that price may return to complete the auction.
However, price is not required to return. Unfinished auctions should be treated as reference points, not automatic targets.
Cumulative Delta
Cumulative Delta tracks the running difference between aggressive buying and aggressive selling over time.
If Cumulative Delta rises, aggressive buying has been stronger over the selected period. If it falls, aggressive selling has been stronger.
Cumulative Delta can also diverge from price. For example, price may make a new high while Cumulative Delta fails to confirm the move. This may suggest weakening participation, but it is not a guaranteed reversal signal.
Delta divergence should be interpreted with support and resistance, trend, liquidity, and session context.
How to Read Footprint Charts?
A structured process helps reduce information overload.
- Start with market context: Identify whether the market is trending, ranging, volatile, or quiet.
- Review price structure: Look at the candlestick or bar structure to understand price movement.
- Check volume concentration: Review where volume was concentrated inside the bar.
- Identify POC and high-volume areas: These areas can help highlight important activity zones.
- Review bid volume and ask volume: Compare aggressive buying and aggressive selling.
- Analyze delta and imbalances: Check whether order flow supports or contradicts price movement.
- Connect order flow to the full plan: Footprint Charts should support a trading decision, not replace the full trading plan.
For example, if price moves higher but delta weakens and strong absorption appears near resistance, the move may be losing strength. If price breaks a level with strong follow-through, increasing volume, and supportive delta, the breakout may have stronger participation.
Footprint Charts and Breakouts
Footprint Charts can help evaluate whether a breakout has participation behind it.
In an upward breakout, traders may look for strong executed buying, positive delta, and follow-through above the breakout level. In a downward breakout, they may look for strong executed selling, negative delta, and follow-through below support.
A breakout with weak delta, low volume, or immediate absorption may be more vulnerable to failure.
Still, no order flow signal guarantees continuation. Breakouts can fail even when the footprint appears strong, especially during news events, low liquidity, or larger timeframe resistance.
Footprint Charts and Reversals
Reversal analysis with Footprint Charts often focuses on absorption, exhaustion, and delta divergence.
A potential reversal may appear when price reaches an important level and aggressive buying fails to push price higher, or aggressive selling fails to push price lower.
For example, if price tests a resistance zone and the Footprint Chart shows heavy aggressive buying with no meaningful upward progress, this may suggest buying is being absorbed.
That does not mean a short trade is automatically valid. The trader still needs structure, confirmation, risk-reward, and an invalidation point.
Large Executed Volume and Participant Activity
Footprint Charts can show unusually large executed volume, but they cannot prove who placed the orders.
A large volume cluster may suggest important activity, but it does not automatically confirm institutional buying or selling. The participant type cannot be identified from the chart alone.
A more accurate way to describe this is: Footprint Charts may help traders identify large executed volume, absorption, or aggressive order flow at specific price levels.
This can be useful, but it should not be overstated as “detecting institutions.”
Footprint Charts for Scalping and Day Trading
Footprint Charts may provide detailed execution context for scalpers and day traders.
Short-term traders often need to understand immediate buying and selling pressure. Footprint Charts can help them monitor imbalances, absorption, exhaustion, and volume concentration around entry areas.
However, scalping with Footprint Charts requires reliable data, fast execution, platform stability, and strict risk management.
The more active the trading style, the more important spreads, commissions, slippage, and execution speed become.
Footprint Charts in Futures, Forex, CFDs, and Crypto
Footprint Charts are often more reliable in centralized exchange-traded markets where accurate tick data is available.
- Futures markets: Executed volume is usually clearer because trading happens on centralized exchanges.
- Spot forex: There is no single centralized exchange volume, so platforms may use broker-specific volume or tick volume.
- CFDs: Volume and order flow data may depend on the broker’s feed and product structure.
- Crypto markets: Order flow may vary across exchanges, and one exchange’s data may not represent the entire market.
This does not mean Footprint Charts are useless outside futures. It means traders must understand what data they are actually seeing.
Combining Footprint Charts with Technical Analysis
Footprint Charts work better when combined with broader analysis.
- Support and resistance: Help identify where order flow matters most.
- Trend analysis: Helps avoid taking weak reversal signals against strong momentum.
- Volume Profile: Highlights important high-volume zones.
- DOM: Shows nearby resting liquidity, although that liquidity can change quickly.
- RSI and MACD: May add momentum context, but they should not replace risk management.
A trader might use price structure to identify an important level, then use Footprint Charts to see whether buying or selling activity supports the trade idea.
How to Choose Footprint Chart Software?
Choosing Footprint Chart software depends on the market you trade, the quality of available data, platform stability, and customization needs.
Important factors include reliable real-time tick data, bid/ask display, delta tools, imbalance settings, replay features, volume filtering, POC display, and platform speed.
Some platforms focus heavily on futures order flow. Others provide order-flow-style tools or volume-at-price features, but depth and accuracy can vary.
Do not choose a platform only because it is cheap or visually attractive. For Footprint analysis, data quality and stability matter.
Data Requirements for Footprint Analysis
Accurate Footprint analysis requires reliable tick-by-tick data.
The data should show executed trades, price, volume, and trade classification when available. Some platforms also integrate order book data.
A stable low-latency internet connection is important, especially for active intraday trading. Delayed or incomplete data can make Footprint interpretation less reliable.
Traders should also understand whether their data comes from an exchange, broker, aggregated provider, or a single trading venue.
Setting Up a Footprint Chart Workspace
A practical workspace should be clean and focused.
Many traders use a Footprint Chart alongside a regular candlestick chart, Volume Profile, DOM, or higher timeframe structure chart. The goal is not to fill the screen with tools. The goal is to see the most important information clearly.
A simple setup may include one higher timeframe chart for context and one lower timeframe Footprint Chart for execution detail.
Color settings and filters should reduce noise, not create confusion. New traders should start with fewer features and add complexity only after they understand the basics.
Backtesting and Replay
Footprint strategies should be tested before live trading.
Many professional platforms offer replay features that allow traders to review historical tick data as if the market were unfolding live. This can help traders practice reading imbalances, absorption, delta shifts, and failed breakouts.
The sample should be large enough and should include different market conditions, such as trending sessions, ranging sessions, news periods, and low-liquidity environments.
Backtesting does not guarantee future results. Live trading may differ because of slippage, spread, liquidity changes, execution speed, and emotional pressure.
Risk Management with Footprint-Based Entries
Footprint Charts may help refine invalidation areas, but they do not remove the need for risk management.
If a trade idea is based on absorption at a specific level, a trader may use that area to define where the idea becomes invalid. However, the Stop Loss should still consider volatility, liquidity, spread, and market structure.
Tighter stops are not always better. If a stop is too tight for the market’s volatility, the trade may be closed before the idea has room to develop.
Some traders use fixed-percentage risk rules, but the suitable risk level depends on account size, strategy, instrument, and risk tolerance.
Footprint Charts in MENA Markets
Some traders in MENA markets may use order-flow tools where reliable data is available.
The usefulness of Footprint Charts depends on the instrument, exchange, broker, liquidity, and data feed. Listed stocks, futures, CFDs, forex products, and crypto markets may all provide different levels of volume transparency.
In regional markets, traders should also consider market hours, liquidity concentration, local news, price limits, earnings announcements, and trading rules.
High-volume activity on listed stocks or regional instruments may deserve closer analysis, but it does not confirm institutional accumulation or distribution.
Regulatory and Data Considerations
Footprint Charts are technical analysis tools. The chart itself is not the main regulatory issue. The product being traded, the broker or exchange, and the jurisdiction matter more.
Traders should verify that they are using authorized entities for the specific product and jurisdiction relevant to them.
In some markets, access to forex, CFDs, crypto, or leveraged products may be restricted or subject to specific rules. Traders should check official sources and broker risk disclosures before trading.
This section is educational and does not provide legal advice.
Common Misconceptions About Footprint Charts
- Footprint Charts do not reveal the future: They show executed activity and help traders interpret market behavior.
- Large volume does not always mean continuation: It may also mean absorption, liquidation, disagreement, or a temporary liquidity event.
- Positive delta does not guarantee higher prices: Delta must be read with price response.
- Negative delta does not guarantee lower prices: Strong passive buying may absorb aggressive selling.
- Footprint Charts are not a holy grail: They are useful tools, but they still require context, testing, and risk management.
Are Footprint Charts Suitable for Beginners?
Footprint Charts can be difficult for complete beginners because they contain a lot of information.
A trader should first understand basic price action, order types, bid and ask, spread, volume, support and resistance, and risk management.
Beginners who want to learn Footprint Charts should start slowly. They can first observe bid volume, ask volume, and delta beside a normal candlestick chart. Then they can study one concept at a time, such as imbalances or absorption.
Replay and demo practice are useful before live trading because live interpretation can be overwhelming.
FAQs
What is the main difference between Footprint Charts and Bookmap?
Footprint Charts focus on executed volume inside price bars. They show how much volume traded at specific price levels and may separate bid and ask activity. Bookmap focuses more on order-book liquidity visualization and shows resting liquidity over time, often through a heatmap. Both tools support order flow analysis differently.
Are Footprint Charts useful for scalping?
Footprint Charts can be useful for scalpers who understand order flow, but they require reliable data, fast execution, practice, and strict risk control. They may help identify short-term absorption, imbalances, and aggressive buying or selling, but they do not guarantee successful trades or remove the need for a complete trading plan.
Can I use Footprint Charts for free?
Some platforms may offer free trials, limited features, delayed data, or simplified volume-at-price tools, but professional-grade Footprint Chart software and reliable real-time tick data are often paid. Traders should check whether the available data is suitable for their market, strategy, execution style, and learning stage before relying on it.
What data do Footprint Charts need?
Footprint Charts need detailed trade data, usually tick-by-tick executed volume. The quality and source of this data matter because exchange-traded markets often provide clearer volume data. Spot forex, CFDs, and some crypto markets may rely on broker-specific or exchange-specific feeds, which can limit interpretation accuracy.
Do professional traders use order flow tools?
Some active and professional traders use order flow tools, especially in exchange-traded markets where volume and tick data are clearer. However, using professional tools does not make a trader professional. The real value comes from understanding the data, testing a method, managing risk, and interpreting market context correctly.
How can I learn Footprint Chart analysis?
Start with the basics: bid volume, ask volume, delta, imbalances, absorption, and POC. Then use replay or demo practice to study how these concepts appear in different market conditions. Avoid trying to interpret every number at once. Focus on one or two patterns first, then expand gradually.
What features should I look for in Footprint Chart software?
Useful features include bid/ask display, delta tools, imbalance settings, POC display, volume filters, replay mode, stable data feed integration, and customization options. The most important factor is not the number of features, but whether the platform provides reliable data and helps you read market activity clearly.