

Pivot Points are predefined technical levels used to identify potential support and resistance areas during a trading session. They are calculated using the previous period’s high, low, and closing prices, creating a central Pivot Point alongside additional support and resistance levels.
Traders may use these levels to prepare scenarios for possible reversals, breakouts, pullbacks, and risk-management decisions. However, a Pivot Point is not an automatic buy or sell signal. Price may react to a level, move through it, or ignore it entirely depending on market momentum, liquidity, volatility, and news conditions.
In this Evest guide, you will learn how Pivot Points are calculated, what PP, S1–S3, and R1–R3 represent, how the main Pivot Point methods differ, and how to calculate the levels using Evest’s Pivot Point Calculator. You will also see how traders may combine Pivot Points with market structure, confirmation, and a defined risk plan.
What Are Pivot Points?
Pivot Points are mathematically calculated price levels that traders use to map potential support and resistance zones before or during a trading session.
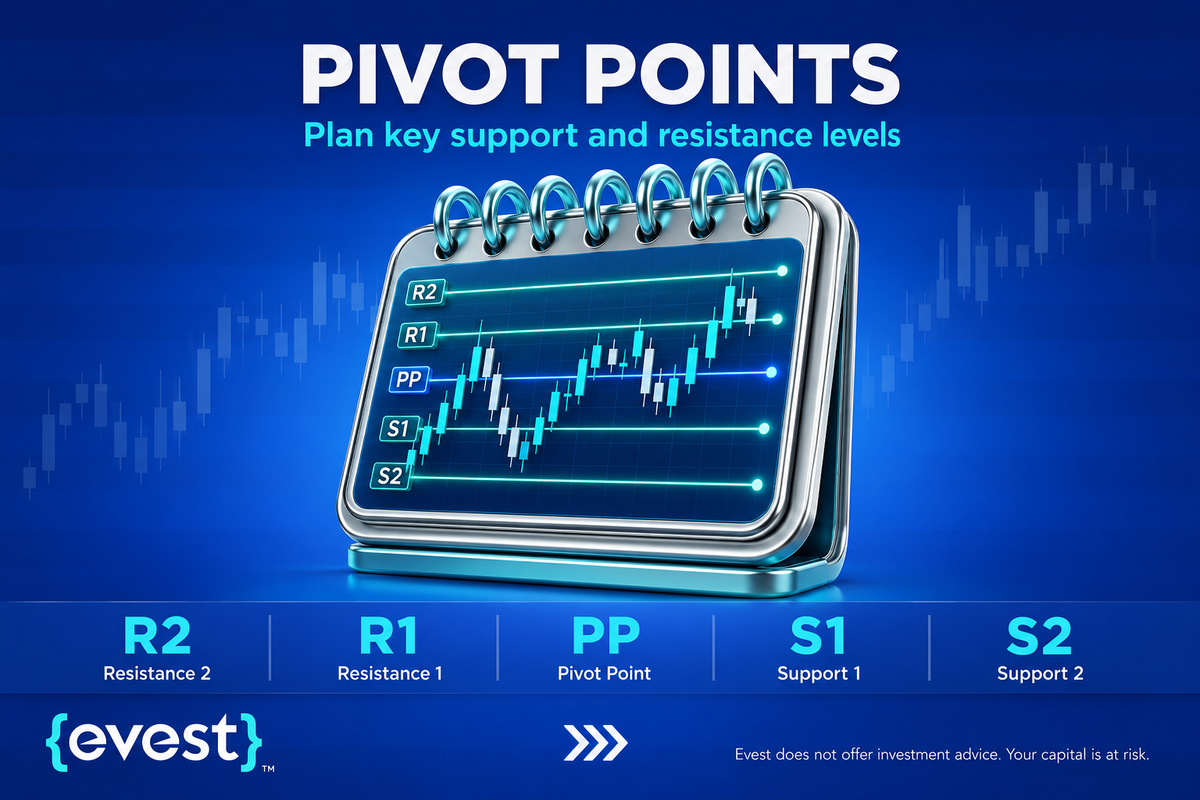
The central level is known as the Pivot Point, or PP. Levels above it are usually labelled R1, R2, and R3, representing potential resistance areas. Levels below it are labelled S1, S2, and S3, representing potential support areas.
Daily Pivot Points are commonly used for intraday analysis, while weekly and monthly calculations may provide broader reference levels for swing or position traders.
These levels do not predict what price will do next. Instead, they give traders a structured map of areas where price behaviour may deserve closer attention.
Traders use Pivot Points because they provide a repeatable framework for organising potential support and resistance levels.
Unlike manually drawn levels, Pivot Points are calculated using a fixed formula. This may reduce some subjectivity and help traders prepare possible scenarios before a session starts.
Some traders interpret price above the central Pivot Point as a possible bullish intraday bias and price below it as a possible bearish bias. This interpretation should not be confused with a confirmed trend.
A more practical approach is to use the levels to answer three questions:
- Where might price react?
- What confirmation would be needed before considering a setup?
- At what point would the original trading idea become invalid?
This turns Pivot Points into a planning tool rather than a prediction tool.
Pivot Points Are Reference Levels, Not Signals
One of the biggest misunderstandings about Pivot Points is treating them as direct entry signals.
For example, price reaching S1 does not automatically mean traders should buy. Price reaching R1 does not automatically mean traders should sell.
A better way to use Pivot Points is to treat them as areas worth watching. The trader should then ask:
- Is price reacting clearly at the level?
- Is there confirmation from price action, volume, trend, or market structure?
- Does the trade have a clear invalidation point?
- Is the risk-reward reasonable?
- Is there any major news or liquidity issue?
Without these questions, Pivot Points can easily create false confidence.
Standard Pivot Point Formula
The standard, or Classic, Pivot Point is calculated using the previous period’s high, low, and closing prices:
PP = (High + Low + Close) ÷ 3
Where:
- High is the highest price recorded during the previous calculation period.
- Low is the lowest price recorded during that period.
- Close is the period’s closing price.
For example, assume the previous session recorded:
- High: 1.2050
- Low: 1.1950
- Close: 1.2000
The central Pivot Point would be:
PP = (1.2050 + 1.1950 + 1.2000) ÷ 3
PP = 1.2000
The definition of the “previous period” depends on the selected calculation. A daily Pivot Point uses the previous daily session, while weekly and monthly Pivot Points use the previous week or month.
Traders should also check the data source and session closing time used by their platform. Different session definitions may produce different Pivot Point values for the same instrument.
Calculating Support and Resistance Levels
After calculating PP, the standard support and resistance levels can be calculated as follows:
- R1 = (2 × PP) − Low
- S1 = (2 × PP) − High
- R2 = PP + (High − Low)
- S2 = PP − (High − Low)
- R3 = High + 2 × (PP − Low)
- S3 = Low − 2 × (High − PP)
| Level | Calculation | Result |
| PP | (1.2050 + 1.1950 + 1.2000) ÷ 3 | 1.2000 |
| R1 | (2 × 1.2000) − 1.1950 | 1.2050 |
| S1 | (2 × 1.2000) − 1.2050 | 1.1950 |
| R2 | 1.2000 + (1.2050 − 1.1950) | 1.2100 |
| S2 | 1.2000 − (1.2050 − 1.1950) | 1.1900 |
| R3 | 1.2050 + 2 × (1.2000 − 1.1950) | 1.2150 |
| S3 | 1.1950 − 2 × (1.2050 − 1.2000) | 1.1850 |
The calculation provides a map of potential levels for the next period. It does not determine which level price will reach or whether the market will react when it gets there.
How to Calculate Pivot Points with Evest?
Evest’s Pivot Point Calculator allows traders to calculate potential support and resistance levels without performing each formula manually.
To use the calculator:
- Select the Pivot Point calculation tool.
- Enter the previous period’s high, low, and closing prices.
- Review the calculated central Pivot Point.
- Record the support and resistance levels generated by the tool.
- Compare the levels with the current chart, trend, volatility, and market structure.
The calculator reduces manual calculation errors, but it does not evaluate whether a trade should be opened. Traders still need to consider the instrument, timeframe, session definition, spread, liquidity, market events, and their own risk rules.
The resulting levels should therefore be treated as analytical references rather than personalised recommendations or guaranteed trading signals.
Main Types of Pivot Points
There are several types of Pivot Points. Each uses a slightly different calculation method.
No Pivot Point method is universally better than the others. The best method depends on the market, timeframe, trading style, and tested strategy.
| Type | Main Idea | Common Use |
| Classic Pivot Points | Uses high, low, and close | General intraday support and resistance |
| Fibonacci Pivot Points | Adds Fibonacci ratios to pivot calculations | Traders who already use Fibonacci concepts |
| Camarilla Pivot Points | Creates tighter levels closer to price | Short-term reversal and intraday analysis |
| Woodie’s Pivot Points | Gives more weight to the close | Traders focused on the previous session’s closing bias |
| Demark Pivot Points | Uses open-close relationship | Alternative method for mapping possible levels |
Classic Pivot Points
Classic Pivot Points are the most widely recognized method.
They use the previous period’s high, low, and close to calculate the central Pivot Point and the related support and resistance levels.
Their simplicity is one reason they are popular. Many traders can calculate or display them easily, and they are available on most charting platforms.
Classic Pivot Points are often used for intraday trading, but they can also be calculated from weekly or monthly data to create broader reference levels.
Fibonacci Pivot Points begin with the same central PP used in the Classic method. The previous period’s range is then multiplied by Fibonacci ratios to calculate support and resistance levels.
Common formulas include:
- R1 = PP + (0.382 × Range)
- S1 = PP − (0.382 × Range)
- R2 = PP + (0.618 × Range)
- S2 = PP − (0.618 × Range)
- R3 = PP + (1.000 × Range)
- S3 = PP − (1.000 × Range)
Where:
Range = Previous High − Previous Low
This method may suit traders who already use Fibonacci-based analysis. However, the presence of a Fibonacci ratio does not make a reaction more certain. The levels remain potential areas that require market context and confirmation.
Camarilla Pivot Points
Camarilla Pivot Points create levels that are often closer to the current price than classic Pivot Points.
This can make them useful for short-term traders who watch for intraday reactions, reversals, or breakouts.
Because the levels can be tighter, they may also create more frequent signals. More signals do not always mean better signals. In choppy markets, tighter levels may increase false setups and overtrading risk.
Camarilla levels should be used with confirmation and strict risk management.
Woodie’s Pivot Points
Woodie’s Pivot Points give more weight to the previous closing price.
The central pivot is commonly calculated as:
PP = (High + Low + 2 × Close) / 4
Because the close has extra weight, Woodie’s Pivot Points may respond differently after strong closing sessions.
Some traders prefer this method because they believe the close reflects the final balance of the previous session. Still, like all Pivot Point methods, it should be tested before being used in live trading.
Demark Pivot Points

Demark Pivot Points use a different calculation method based on the relationship between the open and close.
This method does not create the same set of multiple support and resistance levels as the classic method. Instead, it provides an alternative way to estimate possible reference levels for the next period.
Demark Pivot Points may appeal to traders who want a different calculation structure, but they are not inherently more predictive than other methods.
Pivot Point Bounce Strategy
A Pivot Point bounce strategy looks for evidence that price is rejecting a support or resistance level rather than simply touching it.
For example, when price approaches S1, a trader may monitor whether sellers lose momentum and whether price closes back above the level. Near R1, the trader may look for failed attempts to move higher and a return below resistance.
A structured bounce scenario may include:
- Price reaches a predefined Pivot Point.
- The market shows rejection or a failed break beyond the level.
- The reaction agrees with the broader trend or market structure.
- The setup has a defined invalidation point.
- The potential target provides an acceptable risk-to-reward ratio.
- No major news or abnormal liquidity condition invalidates the setup.
A single wick or level touch is not sufficient evidence by itself. Traders should also avoid placing a Stop Loss at an arbitrary distance from the Pivot Point without considering volatility, spread, and market structure.
Pivot Point Breakout Strategy
A Pivot Point breakout strategy focuses on whether price can break through a pivot support or resistance level with follow-through.
For example, if price breaks above R1, traders may monitor whether the breakout holds, whether volume supports the move, and whether price retests the level successfully. If price breaks below S1, traders may look for similar confirmation in the opposite direction.
A candle close beyond the level may help, but it is not always enough. Breakouts can fail quickly, especially in low-liquidity sessions or before major news.
A responsible breakout plan should include entry criteria, invalidation, Stop Loss, Take Profit, and a reason to avoid the trade if conditions are not clear.
Combining Pivot Points with Other Indicators
Pivot Points may become more useful when combined with other tools.
- RSI: Can help show whether price is extended, but an overbought RSI near resistance is not an automatic sell signal.
- MACD: May add momentum context, but it should not be treated as confirmation by default.
- Moving averages: Can help identify trend direction, but they can lag during fast market moves.
- Bollinger Bands: May show price extension, but a touch of the upper or lower band does not guarantee reversal.
- Main goal: The goal is not to stack many indicators until the chart looks convincing. The goal is to understand whether different tools support the same market idea.
Multi-Timeframe Pivot Point Analysis
Multi-timeframe analysis can help traders understand whether important levels align across different periods.
For example, a trader may use weekly Pivot Points to understand broader context, daily Pivot Points for intraday structure, and a shorter timeframe chart for execution.
If a daily pivot level aligns with a weekly support or resistance area, traders may treat that zone as more important. However, alignment does not guarantee reaction.
Multi-timeframe analysis may help filter some weak setups, but false signals can still occur.
Using Volume and Order Flow with Pivot Points
Volume and order flow can help traders understand what happens when price reaches a Pivot Point.
For example, a breakout above R1 with strong participation may be more meaningful than a weak move with low volume. A test of S1 with strong buying response may suggest that buyers are defending the area.
Order flow may show large executed volume or visible activity near a level, but it does not prove institutional involvement by itself.
These tools can improve context, but they should not turn Pivot Points into automatic trading signals.
Stop Loss and Take Profit Planning
Pivot Points can help traders plan Stop Loss and Take Profit areas more systematically.
For example, if a trader considers a long trade near S1, they may use the area below S1 or S2 as a possible invalidation zone. If a trader considers a short trade near R1, they may use the area above R1 or R2 as a possible invalidation zone.
However, Stop Loss placement should not be based only on the pivot level. It should also consider spread, volatility, liquidity, market structure, and account risk.
Take Profit targets may include the central Pivot Point, the next support or resistance level, or another technical area. Targets should also consider trend strength, news, liquidity, and risk-reward.
Limitations of Pivot Points
Pivot Points are useful, but they have clear limitations.
- Based on previous data: They are calculated from previous-period data, so they are reference levels rather than predictive signals.
- Cannot know future events: They cannot predict future news, liquidity changes, order flow shifts, or macro events.
- Can fail in choppy markets: Price may cross pivot levels repeatedly, creating whipsaws and false signals.
- Can fail in volatile markets: Price may overshoot levels before reacting or may ignore them completely.
- Affected by unusual ranges: Pivot Points can become less useful when the previous period had an unusually large or unusually small range.
- Need market context: The trader should always ask whether the current market condition supports the use of pivot-based analysis.
Psychological Mistakes When Using Pivot Points
Clear levels can create false confidence.
- Anchoring to a level: A trader may insist that price must react at a Pivot Point.
- Holding losing trades: Anchoring can lead to holding losing positions even when the market condition has changed.
- Adding to losing positions: Traders may add more exposure because they believe the pivot level must hold.
- Overtrading: Pivot Points create many visible levels, which may tempt traders to act on every touch, bounce, or breakout.
- Confirmation bias: A trader may only notice evidence that supports the pivot idea and ignore signals that contradict it.
- No written plan: Pivot Points work best when they are part of a written trading plan, not when they become the entire plan.
Pivot Points in MENA Markets
Pivot Points can be applied mathematically across markets, including regional indices, stocks, forex products, commodities, and CFDs. However, usefulness depends on liquidity, trading hours, market behavior, and the quality of available data.
For indices such as TASI, traders may use Pivot Points to map possible daily or weekly reference zones. However, they should test how these markets react to pivot levels before relying on them.
Local market conditions matter. Trading hours, news flow, liquidity concentration, daily price limits, and sector behavior may all affect how price reacts around pivot levels.
A strong break above a resistance pivot may suggest short-term buying pressure if supported by volume and market context, but it does not guarantee continuation.
Regulatory and Broker Considerations
Pivot Points themselves are technical tools. They are not regulated as trading products.
The regulatory concern is the product being traded, the broker or exchange used, the legal entity holding the account, and the jurisdiction where the trader is located.
Traders should verify that the provider is authorized for the specific product and region relevant to them. Leverage limits, product availability, risk disclosures, and account protections can differ by jurisdiction, entity, and product.
Swap-Free or Islamic account terms should also be reviewed separately. They do not affect Pivot Point calculations, but they may matter to traders who require specific account structures.
This section is educational and does not provide legal advice.
Choosing a Platform for Pivot Point Analysis
A suitable platform should make it easy to display and customize Pivot Points.
Useful platform features may include MT4, MT5, or cTrader support, daily and weekly pivot indicators, custom calculation methods, reliable data feeds, execution tools, chart templates, and mobile access.
The platform should also provide clear information about spreads, commissions, swaps, margin rules, order execution, and risk disclosures.
Traders should avoid choosing a platform only because it offers many indicators. Data quality, execution conditions, regulation, and transparency are more important.
Mobile Pivot Point Analysis
Mobile trading apps can help traders monitor Pivot Points and manage planned trades.
However, mobile access can also increase impulsive trading. A trader may see price touch a level and enter quickly without proper analysis.
A better use of mobile trading is to monitor existing plans, manage alerts, and review levels. Important trade decisions should still follow the written trading plan.
Convenience should not replace discipline.
FAQs
Do professional traders use Pivot Points?
Some traders use Pivot Points as part of a broader technical toolkit. They may use them to identify reference levels, plan scenarios, or compare price behavior around common support and resistance zones. However, professional use does not mean Pivot Points guarantee results or replace confirmation, risk management, and broader market analysis.
What is the best Pivot Point method?
There is no single best Pivot Point method for all traders or markets. Classic, Fibonacci, Camarilla, Woodie’s, and Demark Pivot Points all use different calculations. The most suitable method depends on the market, timeframe, trading style, and tested strategy, so traders should compare methods before using them live.
How accurate are Pivot Points?
Pivot Points can highlight possible reaction zones, but their accuracy varies by market condition. They may work better in some sessions and fail completely in others. Their value increases when combined with trend context, price action, volume, liquidity, confirmation, and a clear risk management plan rather than used alone.
Can Pivot Points be used for long-term trading?
Yes, Pivot Points can be used for longer-term analysis, but the calculation period should change. Daily Pivot Points are common for intraday trading, while weekly or monthly Pivot Points may provide broader reference levels for swing or position traders. Even then, traders still need confirmation and risk planning.
What are common mistakes when using Pivot Points?
Common mistakes include buying or selling automatically at every pivot level, ignoring trend context, failing to use Stop Loss, overtrading, and treating pivot reactions as guaranteed. Forcing trades at every pivot touch is one of the biggest mistakes because Pivot Points are reference levels, not automatic entry signals.
What is the success rate of Pivot Point trading?
There is no fixed success rate for Pivot Point trading. Results depend on strategy quality, market conditions, risk management, execution, spread, slippage, trader discipline, and confirmation methods. Pivot Points are analytical tools that help map possible levels, but they are not guaranteed profit signals or standalone trading systems.