
Volume-Weighted Average Price, commonly known as VWAP, is an intraday benchmark that calculates an asset’s average traded price while giving greater weight to periods with higher trading volume.
Traders use VWAP to compare the current market price with the session’s volume-weighted average, assess execution quality, and understand intraday price context. Standard VWAP usually resets at the beginning of each trading session, while Anchored VWAP can begin from a selected event or price point.
VWAP does not predict future price direction and should not be treated as an automatic buy or sell signal. Its interpretation depends on market structure, liquidity, session settings, volume-data quality, transaction costs, and risk management.
What Is Volume Weighted Average Price?
Volume-Weighted Average Price is a benchmark that represents the average traded price of an asset over a selected period after weighting each price by its associated trading volume.
In simple terms, VWAP answers the following question:
What was the average price paid during the period after accounting for how much volume was traded at each price?
Prices associated with higher trading volume have a greater influence on the calculation than prices associated with lower volume. This makes VWAP different from price-only averages, which treat every price observation equally.
VWAP should not be confused with the price level where the highest volume occurred. Identifying the single price with the greatest traded volume is more closely associated with tools such as Volume Profile and the Point of Control.
Why Traders Use VWAP?
Traders use VWAP because it can help them compare the current price with the average price paid by market participants during a session.
- Intraday price context: If price is trading above VWAP, it may suggest stronger intraday buying pressure. If price is trading below VWAP, it may suggest weaker intraday conditions or stronger selling pressure.
- Execution quality: Institutional traders may compare execution quality against VWAP. For example, a large buyer may want to understand whether their average execution price was favorable compared with the session’s volume-weighted average.
- Retail trading structure: For retail traders, VWAP can help organize intraday analysis, but it should not be reduced to a simple rule such as “buy above VWAP and sell below VWAP.”
VWAP Formula
At the trade level, VWAP can be expressed as:
VWAP = Σ(Trade Price × Trade Volume) ÷ ΣTrade Volume
This calculation multiplies the price of each transaction by the quantity traded, adds the resulting values, and divides the total by cumulative volume.
When VWAP is calculated from candlestick data rather than individual trades, many charting platforms use the candle’s typical price as an approximation:
Typical Price = (High + Low + Close) ÷ 3
The candle-based calculation can then be expressed as:
VWAP = Σ(Typical Price × Candle Volume) ÷ ΣCandle Volume
The exact calculation may vary slightly between charting platforms, data providers, asset classes, and session settings.
How VWAP Is Calculated During the Trading Day?
VWAP is usually calculated cumulatively throughout the session.
At each new interval, the platform calculates the typical price, multiplies it by volume, adds it to the cumulative price-volume total, and divides the result by cumulative volume.
A simplified table may look like this:
| Interval | Typical Price | Volume | Price × Volume | Cumulative Price × Volume | Cumulative Volume | Cumulative VWAP |
| 1 | $10.00 | 100 | $1,000 | $1,000 | 100 | $10.00 |
| 2 | $11.00 | 200 | $2,200 | $3,200 | 300 | $10.67 |
| 3 | $10.50 | 300 | $3,150 | $6,350 | 600 | $10.58 |
The final value is calculated as:
$6,350 ÷ 600 = $10.58
VWAP updates throughout the session as new price and volume information enters the cumulative calculation.
Key Inputs Price, Volume, and Session
VWAP depends on three main inputs: price, volume, and the selected session.
- Price: Usually represented by the typical price of each candle.
- Volume: Shows how much activity occurred during that interval.
- Session: Defines the period from which VWAP starts calculating.
For many stocks, VWAP resets at the start of the trading day. For markets with extended or nearly continuous trading hours, such as futures, crypto, forex CFDs, or some commodities, traders need to define the session carefully.
A poorly selected session can make VWAP less useful because the benchmark may not match the market activity the trader is trying to analyze.
VWAP and Volume Data Quality
VWAP is only as reliable as the volume data behind it.
In exchange-traded markets such as stocks and futures, volume is usually more centralized and easier to interpret. In decentralized markets such as spot forex, there is no single centralized exchange volume.
Because of that, VWAP on spot forex charts may rely on broker-specific volume or tick volume. Tick volume measures price updates rather than total market-wide traded volume. It can still be useful for some traders, but it is not the same as centralized exchange volume.
For CFDs, VWAP and volume data may depend on the broker’s data feed and product structure. Traders should understand this limitation before relying heavily on VWAP in non-centralized markets.
Common Mistakes and Limitations When Using VWAP
- Treating VWAP as guaranteed support or resistance: VWAP may act as a reference area during trending sessions, but it can fail.
- Ignoring choppy market conditions: In sideways or choppy markets, price may cross above and below VWAP many times, creating false signals and whipsaws.
- Using the wrong session settings: This is especially important in 24-hour markets where the start and end of a session may change the VWAP line significantly.
- Ignoring volume context: A VWAP cross with weak participation may carry less meaning than a move supported by stronger volume and clearer market structure.
Interpreting VWAP in Trending and Ranging Markets
VWAP can provide useful intraday context, but its interpretation changes with the type of market session.
During an established uptrend, price may remain above a rising VWAP and occasionally pull back toward the benchmark. Traders may monitor the area to see whether the wider bullish structure remains intact. During a downtrend, price may remain below a falling VWAP and retest it during temporary rallies.
VWAP should be treated as a reference zone rather than guaranteed support or resistance. A touch, cross, or rejection does not automatically create a valid trade. Price action, trend structure, participation, volatility, liquidity, and risk-to-reward conditions should support the interpretation.
In ranging or choppy markets, price may cross VWAP repeatedly without developing a sustainable direction. These repeated crosses can create false signals and whipsaws.
Before using VWAP in a trading plan, traders should first assess whether the session is trending, ranging, highly volatile, or experiencing weak participation.
How VWAP May Be Used Within a Trading Setup?
- Some traders monitor VWAP reclaims, rejections, and pullbacks as part of a wider intraday setup.
- VWAP reclaim: Price moves back above the benchmark after previously trading below it. A reclaim may become more relevant when supported by a higher low, improving participation, or a confirmed break in short-term market structure.
- VWAP rejection: Price approaches VWAP but fails to move through it. A rejection should be assessed alongside the prevailing trend, nearby price levels, volume context, and confirmation from price action.
- VWAP pullback: During a trending session, a return toward VWAP may provide an area for further observation. The touch itself is not an entry signal.
- Trade invalidation: When a setup depends on price remaining on one side of VWAP, a sustained move through the benchmark may weaken the original idea. However, the final invalidation level should come from the complete market structure.
- Stop Loss and Take Profit levels should not be placed automatically around VWAP. They should account for volatility, liquidity, nearby support or resistance, spread, slippage, position size, and the amount of capital at risk.
Mean Reversion and VWAP Bands
VWAP bands are plotted above and below the main VWAP line and are commonly calculated using standard-deviation levels or another measure of price dispersion.
The bands can help traders assess how far price has moved from the session’s volume-weighted average. A move toward an outer band may indicate that price is extended relative to the session benchmark.
However, extension does not guarantee mean reversion. During a strong directional session, price may remain near an outer band or continue moving farther away from VWAP.
A potential mean-reversion setup therefore requires more than an outer-band touch. Traders should consider session type, volatility, momentum, market structure, liquidity, transaction costs, and signs that the current move is losing strength. VWAP bands are tools for measuring relative extension, not tools that predict an automatic reversal.
Hypothetical Example of a VWAP Pullback
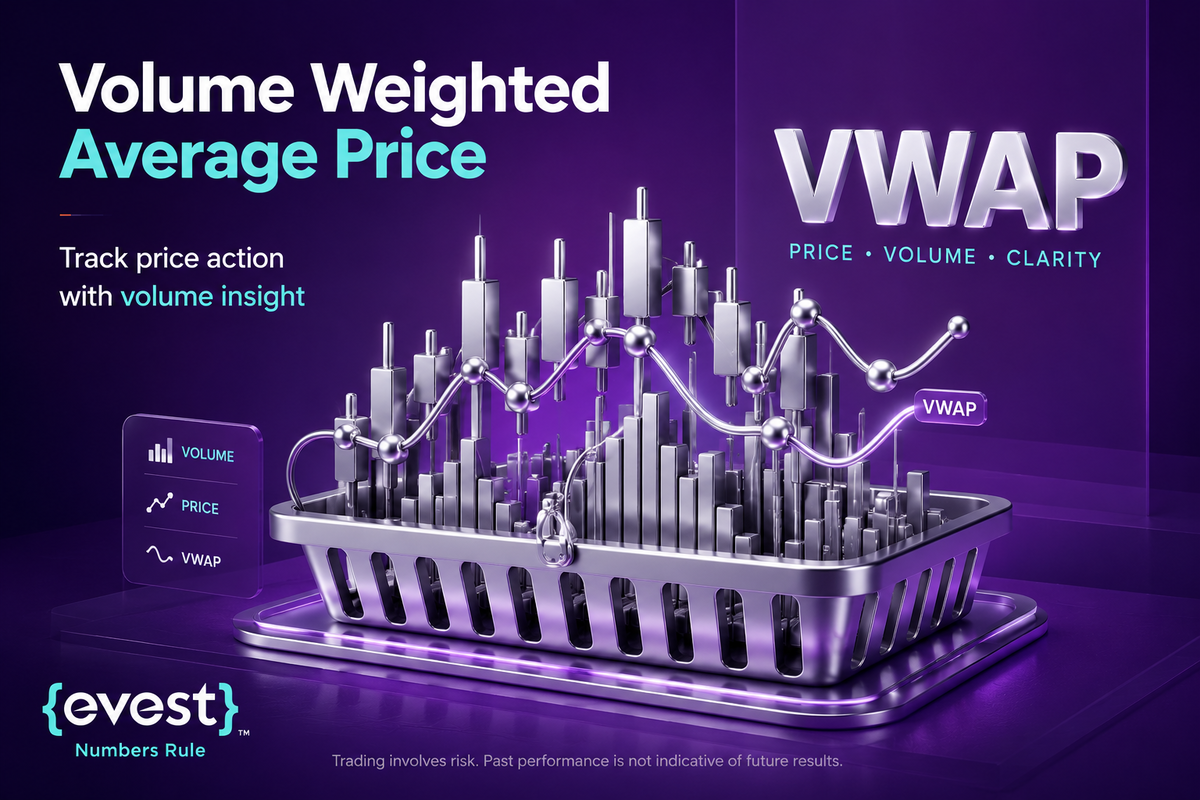
The following example is for educational purposes only and is not a trading recommendation.
Assume EUR/USD is trading in a clear intraday uptrend on a platform that uses broker-specific volume or tick volume. Price pulls back toward VWAP after a strong move higher. A trader may monitor whether buyers defend that area and whether price forms a higher low.
Even in this situation, the setup is not complete just because price touches VWAP. The trader would still need to check trend structure, confirmation, spread, session liquidity, Stop Loss placement, and whether the risk-reward makes sense.
VWAP for Day Traders
Day traders often use VWAP as a real-time intraday benchmark.
It can help them understand whether price is trading above or below the session’s volume-weighted average. It can also help identify possible pullback areas, intraday bias, and execution context.
However, day traders should not ignore transaction costs. Spread, slippage, commissions, liquidity, and execution speed can all affect results.
A VWAP setup that looks good on a chart may perform poorly if the trading cost is high or the market is moving too quickly.
VWAP for Institutional Traders
Institutional traders often use VWAP as an execution benchmark.
Large orders can move the market if executed too aggressively. VWAP helps institutions compare their average execution price with the broader session activity.
A trader executing a large buy order may compare the average fill price with VWAP to assess whether the execution was favorable relative to market activity. A seller may do the same from the opposite side.
This does not mean institutions use VWAP the same way retail traders do. For institutions, VWAP is often more about execution quality and market impact than simple entry signals.
Applying VWAP in MENA Markets
VWAP can be used in MENA market analysis, but its usefulness depends on liquidity, market hours, data quality, and instrument type.
For listed stocks on regional exchanges, VWAP may help traders analyze intraday average price and execution context. For indices, commodities, forex, or CFDs, traders should understand how the data is sourced and whether the volume is centralized, broker-specific, or based on tick activity.
Local market structure matters. Trading hours, liquidity concentration, daily price limits, earnings announcements, and local news can all affect how VWAP behaves.
Examples are illustrative only and do not represent recommendations.
Regulatory Context in Saudi Arabia and the UAE
VWAP itself is only a technical benchmark. It is not directly regulated as an indicator. However, the trading activity where VWAP is used may be regulated depending on the product, legal entity, trading venue, and jurisdiction.
Traders should verify that they are dealing with an entity authorized for the specific product and jurisdiction relevant to them.
- Saudi Arabia: Traders should be cautious with unlicensed forex activity and should verify authorization before dealing with any provider.
- UAE: Regulation may differ depending on whether the activity is conducted onshore or within a financial free zone such as DIFC.
- Educational note: This section is educational and does not provide legal advice.
Anchored VWAP
Anchored VWAP, or AVWAP, is a variation that allows traders to start the VWAP calculation from a chosen point rather than the beginning of the current session.
A trader may anchor VWAP from a major swing high, swing low, earnings event, news release, gap, breakout, or important market open. The line then shows the volume-weighted average price from that selected point.
Anchored VWAP may highlight price areas where significant volume has traded since the anchor point. These areas can become useful reference zones, but they are not guaranteed support or resistance.
VWAP Bands
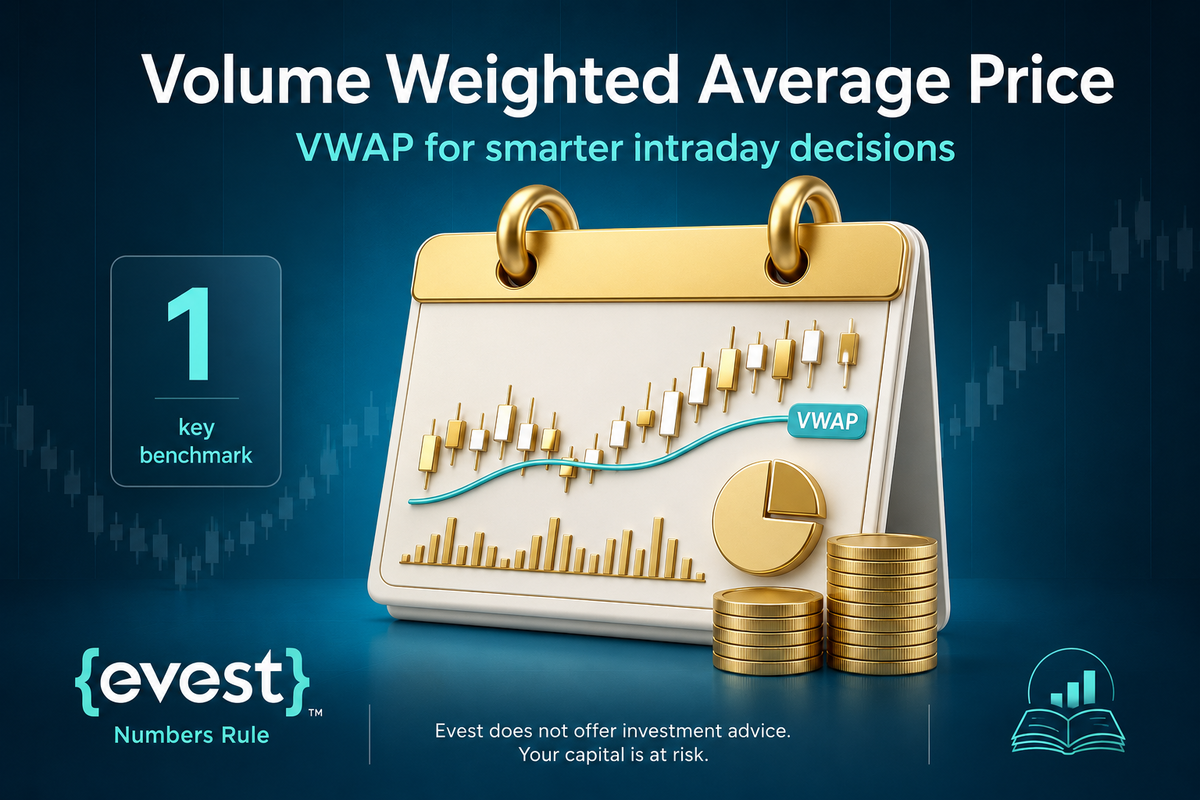
VWAP bands are usually plotted above and below the VWAP line using standard deviation levels.
They can help traders identify whether price is trading close to or far away from the volume-weighted average. If price reaches an outer band, it may indicate extension relative to VWAP.
This does not mean price must reverse. In strong trends, price may continue moving along the outer band. Traders should avoid assuming that every touch of a VWAP band is a reversal signal.
VWAP bands are reference tools, not prediction tools.
Combining Session VWAP and Anchored VWAP
Some traders combine standard session VWAP with Anchored VWAP.
Session VWAP shows the volume-weighted average for the current trading session. Anchored VWAP shows the volume-weighted average from a chosen event or price point.
When both lines align near the same price area, traders may view that zone as worth monitoring. However, confluence does not guarantee support or resistance. It only shows that multiple reference points are near the same area.
A complete analysis should still include market structure, liquidity, volume quality, price action, and risk.
VWAP vs. SMA and EMA
VWAP, SMA, and EMA are all average-based tools, but they are not the same.
| Indicator | How It Works | Main Use |
| VWAP | Gives more weight to prices where more volume occurred | Volume-sensitive intraday benchmark |
| SMA | Gives equal weight to each price point | Broad price smoothing |
| EMA | Gives more weight to recent prices | More responsive trend smoothing |
VWAP may respond more strongly to high-volume areas, while moving averages may be more useful for broader trend smoothing. Neither tool is universally better. The right choice depends on the trader’s goal.
VWAP vs. TWAP
VWAP and TWAP are both benchmarks, but they measure different things.
- VWAP: Weights price by volume and helps compare execution against market activity.
- TWAP: Calculates the average price over time, giving equal weight to each time interval.
- Execution use: TWAP is often used to spread execution over time, while VWAP is often used to compare execution against volume-weighted market activity.
- Important limitation: Both are benchmarks, not standalone prediction tools.
Combining VWAP with RSI, MACD, and Other Indicators
VWAP can be combined with other indicators to build additional confirmation.
For example, RSI may help identify momentum conditions. MACD may help evaluate trend strength or momentum shifts. Bollinger Bands may provide information about volatility and price extension.
However, indicator alignment does not guarantee a successful trade. Indicators can conflict, lag, or produce false signals. They should support analysis, not replace risk management.
A trader may use VWAP for price context, RSI for momentum, and support/resistance for structure, but the final decision still needs a clear trading plan.
How to Use VWAP More Responsibly in Trading Plans?
There is no universal VWAP setting that works for every asset, timeframe, or market condition.
- Define the session properly: For liquid stocks with clear exchange hours, standard daily VWAP may work well as an intraday benchmark.
- Adjust for continuous markets: For futures, crypto, forex CFDs, or commodities, traders may need to define the session differently.
- Choose timeframe carefully: A very short interval may make VWAP more reactive but noisier. A longer interval may smooth the line but reduce sensitivity.
- Test the instrument: Traders should test how VWAP behaves on the specific instrument they trade rather than assuming it works the same everywhere.
Backtesting VWAP Strategies
- Before using a VWAP-based strategy live, traders should test it on historical data.
- Backtesting can help evaluate how the strategy behaved in different conditions, including trending sessions, ranging sessions, high-volatility periods, and low-volume environments.
- The goal is not only to check profit or loss. Traders should also review drawdown, win rate, average loss, average gain, slippage assumptions, number of trades, and sensitivity to market conditions.
- Even a strategy that looks strong in backtesting may perform differently live because of slippage, liquidity, spread changes, and changing market behavior.
Risk Management and Position Sizing with VWAP
- Use VWAP as a reference, not a full risk plan: VWAP may help define reference areas for invalidation, but risk management should come from a complete trading plan.
- Apply VWAP differently for long and short trades: For a long trade, some traders may use VWAP or a nearby VWAP band as a reference area. If price fails to hold above that area, the trade idea may be weakened. For a short trade, the opposite may apply.
- Avoid placing Stop Loss automatically around VWAP: This does not mean the Stop Loss must always be placed directly above or below VWAP. Stop placement should consider volatility, market structure, spread, liquidity, and the amount of capital at risk.
- Choose risk rules based on the full setup: Some traders use fixed percentage risk rules, but the suitable level depends on the strategy, account size, instrument, and personal risk tolerance.
- Control position size carefully: A correct VWAP reading will not protect an account if position size is too large.
Using VWAP When Trading Through Evest
The availability and configuration of VWAP may depend on the trading platform, instrument, account type, and market-data feed available to the Evest client.
Before using the indicator, traders should confirm:
- Whether VWAP is available for the selected instrument.
- Which price and volume data are used in the calculation.
- When the selected trading session begins and ends.
- Whether extended-hours data are included.
- Whether the displayed volume represents exchange volume, broker-specific volume, or tick activity.
- Whether the indicator resets automatically at the start of each session.
Traders should also compare the VWAP settings with the market they intend to analyze. Settings used for exchange-listed shares may not be suitable for forex, indices, commodities, cryptocurrencies, or CFDs.
VWAP should be used as an analytical benchmark alongside market structure, liquidity, transaction costs, and risk-management rules. It should not be treated as a recommendation from Evest to open or close a position.
Internal publishing note: Add a verified screenshot and platform-specific steps only after confirmation from the Evest product and Compliance teams.
FAQs
How does VWAP differ from a simple moving average?
VWAP gives more weight to prices with higher volume, while a Simple Moving Average treats each price point equally. This makes VWAP a volume-sensitive benchmark that reflects where trading activity was concentrated. SMA is mainly a price-based smoothing tool, so each indicator answers a different question and serves a different trading purpose.
Can VWAP be used for swing trading or only intraday?
Standard VWAP is mainly used for intraday analysis because it usually resets at the beginning of each session. However, Anchored VWAP can be used across multiple sessions by starting the calculation from a selected event, date, high, low, or breakout point. Traders should still test whether it fits their strategy.
What is Anchored VWAP?
Anchored VWAP lets traders calculate VWAP from a chosen point instead of the session open. This point may be a swing high, swing low, news event, breakout, gap, or major market open. It may highlight volume-weighted reference areas, but it should not be treated as guaranteed support or resistance.
Is VWAP a leading or lagging indicator?
VWAP is based on historical price and volume data, so it is generally considered a lagging or benchmark-style indicator. It updates throughout the session as new data appears, but it still reflects what has already traded. Traders should not use it as a tool that predicts future price direction.
How do institutional traders use VWAP?
Institutional traders often use VWAP to compare execution quality with session activity. For example, they may evaluate whether a large buy or sell order was executed at a favorable average price relative to VWAP. This use is different from treating VWAP as a simple retail entry or exit signal.