The financial markets are often driven not only by data and fundamentals, but also dominated by fear or greed. One of the most widely used tools to measure these emotions is the fear and greed index, which reflects whether the market is dominated by fear or excessive optimism. This index helps traders understand the overall sentiment and potential direction of market movements.
By analyzing emotional extremes, investors can identify possible buying or selling opportunities. Ultimately, it serves as a guide to balance emotional decision-making with rational analysis in trading.
What Is the Fear and Greed Index?
The fear and greed index is a widely used sentiment indicator designed to measure market psychology by tracking extreme emotions among investors. Developed as a tool to gauge whether traders are overly optimistic or pessimistic, it provides valuable insights into market behavior beyond traditional technical or fundamental analysis. At its core, the index quantifies the collective emotional state of the market, helping investors identify potential turning points before they occur.
Unlike traditional indicators that rely on price movements or economic data, the fear and greed index focuses on psychological factors—such as panic selling or euphoric buying—that often precede market shifts. For example, when the index signals “extreme fear,” it may suggest that assets are undervalued due to irrational selling, while “extreme greed” could indicate overvalued markets ripe for correction. This duality makes it particularly useful for traders seeking to anticipate market sentiment-driven trends.
Why Was It Created?
The creation of the fear and greed index stemmed from a fundamental observation: markets are not always rational. While economic models assume investors make decisions based on logic and data, reality often reveals that emotions—fear, greed, panic, and euphoria—play a dominant role in trading behavior. The index was developed to quantify these emotional drivers and provide a measurable framework for understanding market psychology.
Before its inception, traders relied on anecdotal evidence or qualitative assessments to gauge sentiment. However, these methods lacked consistency and objectivity. The fear and greed index was introduced as a systematic way to track these emotions, offering a standardized metric that could be applied across different markets and timeframes. By doing so, it bridged the gap between subjective sentiment analysis and data-driven decision-making.
How Does the Fear and Greed Index Work?
The Fear and Greed Index is a market sentiment tool that combines multiple indicators to measure whether investors are driven more by fear or greed in the financial markets.
- The index aggregates data from several market indicators, each representing a different aspect of investor behavior and sentiment.
- These indicators are weighted and combined to generate a single score ranging from 0 to 100.
- Lower values indicate extreme fear, while higher values reflect extreme greed in the market.
- The index updates in real time to reflect changing market conditions and investor emotions.
- It captures market psychology extremes, helping identify potential buying or selling pressure.
- When fear dominates, the index drops, often signaling possible buying opportunities.
- When greed dominates, the index rises, which may indicate overvaluation or speculative behavior.
- Reconcile the two statements or clarify the distinction.
- The index helps traders identify contrarian opportunities where market sentiment may reverse.
- It is a composite tool made up of multiple indicators rather than a single data source.
- The weighting of components may vary depending on the market or asset class being analyzed.
- This structure makes the index flexible and useful across different trading environments.
Components of the Index
The fear and greed index is composed of seven key components, each designed to capture a distinct aspect of market sentiment. These components are:
- Market Momentum
- Volatility
- Safe Haven Demand
- Put and Call Options
- Market Breadth
- Junk Bond Demand
- Stock Price Breadth
Market Momentum
Market momentum measures the strength and direction of recent market movements. A strong upward momentum suggests confidence among investors, while declining momentum may indicate growing pessimism. This component is particularly useful for identifying trends and potential reversals.
Volatility
Volatility reflects the degree of price fluctuations in the market. High volatility often accompanies extreme emotions—either fear during sharp declines or greed during rapid rallies. By tracking volatility, the index can signal when market participants are becoming overly cautious or overly optimistic.
Safe Haven Demand
Safe haven demand assesses the flow of capital into traditionally safe assets, such as gold or government bonds. During periods of uncertainty, investors flock to safe havens, reducing demand for riskier assets. This component helps identify when fear is driving market behavior.
Put and Call Options
The ratio of put to call options provides insight into whether investors are hedging against downside risk (puts) or betting on further gains (calls). A high put-to-call ratio often signals fear, while a low ratio may indicate greed.
Market Breadth
Market breadth measures the participation of individual stocks in a market’s overall movement. A broad rally with widespread participation suggests strong confidence, whereas a narrow rally with limited participation may indicate speculative behavior.
Junk Bond Demand
Junk bond demand reflects the appetite for high-risk, high-reward investments. When investors are willing to take on greater risk, it often signals greed. Conversely, a decline in junk bond demand may indicate fear.
Market Breadth
Market Breadth evaluates the number of stocks hitting new highs versus new lows. A high number of new highs suggests bullish sentiment, while an increase in new lows may signal bearishness.
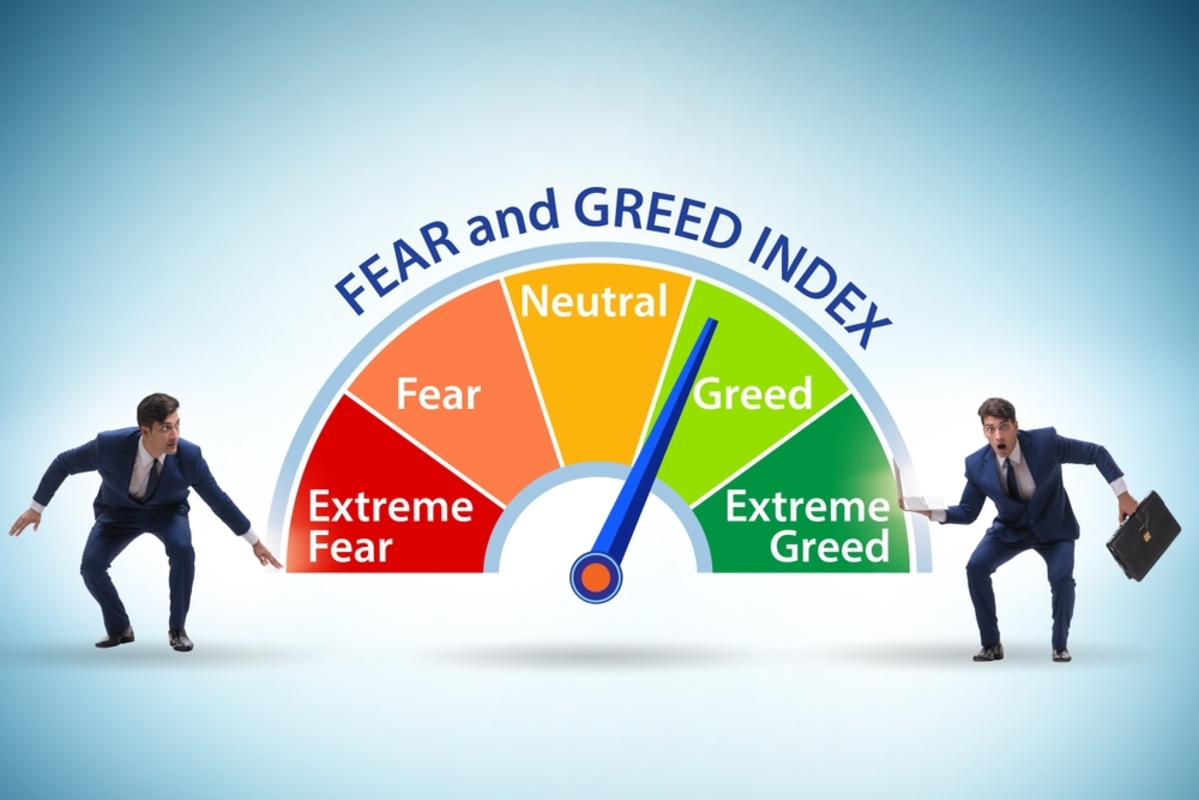
Interpretation of index levels
The Fear and Greed Index is used to measure overall market sentiment by showing how investors are feeling at different stages of the market cycle, ranging from extreme fear to extreme greed.
Extreme Fear
This level indicates that investors are highly pessimistic and strongly risk-averse. Markets are often oversold during this stage, which may create potential buying opportunities for long-term investors.
Fear
At this stage, uncertainty dominates the market, and many investors start selling or avoiding risk. Prices may be under pressure, but it can also signal that negative sentiment is already priced in.
Neutral
A neutral reading reflects a balanced market where neither fear nor greed is dominant. It often suggests that the market is in a consolidation phase with no strong directional bias.
Greed
Greed indicates growing investor optimism and increased buying activity. While this can support upward price momentum, it may also signal that assets are becoming overvalued.
Extreme Greed
This is the highest level of optimism, where investors may be overly confident and speculative. It often appears near market tops and can be a warning of a possible correction or reversal.
How do traders and investors use the index?
The Fear and Greed Index is widely used by traders and investors as a sentiment-based tool to better understand market psychology and improve decision-making in different market conditions.
Timing Market Entries and Exits
Traders use the index to identify potential entry and exit points in the market. When the index shows extreme fear, it may signal a possible buying opportunity, while extreme greed can indicate a good time to take profits or reduce exposure.
Risk Management
Investors rely on the index to adjust their risk levels depending on market sentiment. During high fear or extreme greed phases, they may reduce position sizes, diversify portfolios, or increase hedging strategies to protect capital.
Sentiment Confirmation Tool
The index is also used as a confirmation tool alongside technical or fundamental analysis. It helps traders validate whether market sentiment supports their trading decisions or if the market may be overreacting in one direction.
Limitations of the Fear and Greed Index
The Fear and Greed Index is a useful sentiment indicator, but like any financial tool, it has certain limitations that traders should understand before relying on it for decision-making. It works best when combined with other forms of analysis rather than being used alone.
Not a Standalone Prediction Tool
The index should not be used as the only basis for predicting market movements. It reflects current investor sentiment but does not guarantee future price direction. Successful traders often combine it with technical and fundamental analysis—something that can be easily done using advanced trading platforms like Evest, which provide integrated tools for smarter decision-making.
Lagging vs Leading Signals
In many cases, the Fear and Greed Index acts as a lagging indicator because it reacts to existing market conditions rather than predicting future changes. This means it may confirm trends that are already in motion instead of signaling them early. Therefore, investors should use it as a supportive tool rather than a primary forecasting method.
FAQs
Who created the Fear and Greed Index?
The Fear and Greed Index was originally developed by CNN Business to measure investor sentiment in the financial markets. It was designed to help investors understand whether emotions like fear or greed are driving market behavior.
What factors are included in the Fear and Greed Index?
The index includes several factors such as market momentum, volatility, trading volume, put and call options, safe-haven demand, market breadth, and junk bond demand. Each factor reflects a different aspect of investor behavior and market sentiment.
How is the Fear and Greed Index calculated?
The index is calculated by combining and weighting multiple market indicators into a single score ranging from 0 to 100. Lower values represent extreme fear, while higher values indicate extreme greed in the market.