

gold price prediction in the final months of 2026 in a market defined by high volatility rather than a bullish trend. Spot gold was near $4,363 per ounce on September 11 after recovering from a sharp selloff, while higher inflation and expectations of a Federal Reserve rate increase kept bond yields elevated. The medium-term outlook remains divided. Some institutions expect consolidation near current levels, while others see renewed upside toward $5,000 or even $6,000 if monetary, fiscal, and geopolitical risks intensify. This gold price forecast examines short-term direction, technical levels, market drivers, scenarios, institutional forecasts, and the longer-term outlook.
Gold Price Forecast 2026 Quick Answer
The short-term gold outlook is neutral to moderately bullish, but the market is still vulnerable to interest-rate pressure. Spot gold recovered to about $4,363 per ounce on September 11 after falling sharply earlier in the week, suggesting buyers are still willing to step in near the low-$4,300 area. At the same time, stronger US inflation data pushed expectations for a Federal Reserve rate increase higher, while Treasury yields remained elevated. Those conditions normally create a headwind for a non-yielding asset such as gold, which explains why the metal has struggled to build a sustained breakout despite continuing geopolitical risk.
For the rest of 2026, the strongest evidence supports a wide range rather than one precise target. The World Gold Council’s mid-year framework suggested that, if macro conditions remained broadly unchanged, gold could trade around 5% above or below roughly $4,100. HSBC expected a $3,800 to $4,700 range for the remainder of the year and a year-end level near $4,750. By contrast, J.P. Morgan Global Research maintained a much more bullish path, with a fourth-quarter forecast near $6,000. The gap between those views is a useful warning that the market is being driven by unusually unstable macro and geopolitical forces.
Gold Market Outlook for the Rest of 2026
The second half of 2026 looks very different from the opening months of the year. Gold surged to record highs in January before falling sharply into June, leaving a market that is still expensive by historical standards but no longer moving in one direction.
The World Gold Council described the first half as one of the most volatile starts to a year in gold’s history, with repeated record highs followed by a deep correction. That change in character matters because trend-following strategies that worked during the early rally can become less reliable when prices begin reacting more aggressively to interest rates, the dollar, and profit-taking.
The current market is therefore better described as a battle between structural support and cyclical pressure. Structural support comes from geopolitical fragmentation, fiscal concerns, reserve diversification, and continued investor interest in real assets. Cyclical pressure comes from higher bond yields, the possibility of tighter Federal Reserve policy, and the opportunity cost of holding an asset that pays no interest. Neither side has clearly won. That is why the 2026 gold market outlook should focus on scenarios and triggers rather than treating every dip as automatically bullish or every rate increase as permanently bearish.
The Main Drivers of Gold Prices
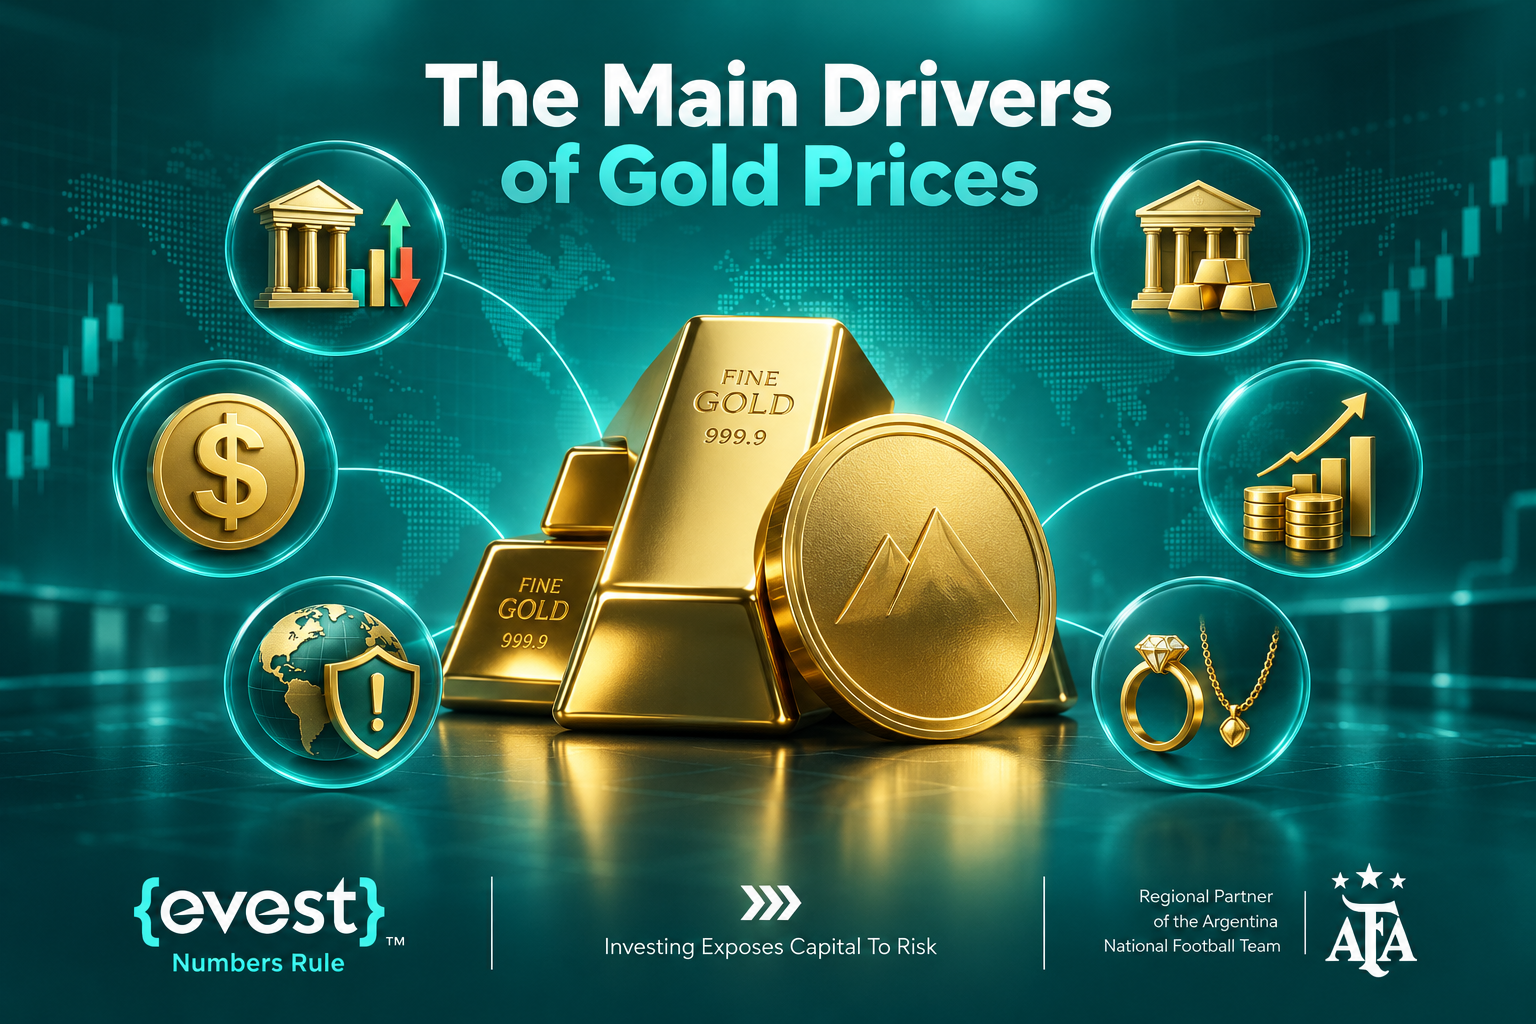
Gold is reacting to several forces at the same time, and the importance of each driver can change quickly. A useful forecast needs to monitor the variables that explain why money is moving into or out of bullion rather than relying only on past price patterns.
- Federal Reserve policy and real yields influence the opportunity cost of holding gold. Higher yields can pressure prices, while falling real yields usually improve gold’s relative appeal.
- The US dollar matters because gold is priced globally in dollars. A stronger dollar can make gold more expensive for non-US buyers, while a weaker dollar often provides support.
- Geopolitical risk can increase safe-haven demand, particularly when conflict threatens energy markets, trade routes, financial stability, or major currencies.
- Central bank buying remains an important structural source of demand, even though reported purchases have slowed from the strongest periods of the previous cycle.
- ETF and institutional flows can amplify both rallies and declines because changes in portfolio allocation can move large amounts of capital quickly.
- Jewellery and physical demand provide an additional layer of support, but very high prices can reduce consumer demand in price-sensitive markets such as India and China.
Federal Reserve Policy and Gold
Federal Reserve policy is the most important short-term macro variable for gold because it influences Treasury yields, the dollar, and the return available on competing assets. In September 2026, stronger US inflation and employment data increased expectations that the Fed could raise rates again.
Reuters reported that market pricing moved sharply toward a September hike after the latest CPI release. Gold still recovered on dip-buying, but the broader message was clear. When investors expect higher policy rates for longer, bullion must compete with cash and government bonds that offer attractive yields.
The relationship is not perfectly mechanical. Gold can rise alongside higher rates when inflation expectations, fiscal concerns, or geopolitical risk rise even faster. It can also fall during periods of expected easing if investors are unwinding crowded positions. The better question is whether real yields and the dollar are rising or falling relative to the level of uncertainty in the market. A sustained decline in real yields would improve the bullish case. A renewed cycle of rate increases combined with a stronger dollar would be one of the clearest bearish threats to the current gold forecast.
Inflation Oil and Geopolitical Risk
Inflation has returned to the center of the gold story because energy prices have become more volatile. Brent crude moved above $100 per barrel in September amid disruptions linked to conflict in the Middle East. Higher energy costs can support gold in two different ways. They can increase demand for an inflation hedge, and they can raise fears about economic instability. However, they can also push central banks toward tighter policy, which raises yields and can pressure bullion. The result is a market where the same geopolitical shock can create both bullish and bearish forces.
This explains why gold’s reaction to geopolitical headlines can look inconsistent. An escalation that increases fear but leaves rate expectations unchanged may push gold higher. An escalation that drives oil sharply higher and convinces markets that the Fed must tighten can strengthen the dollar and bond yields enough to offset safe-haven demand. Investors should therefore avoid assuming that war or political risk automatically means higher gold prices. The transmission through inflation, rates, currencies, and liquidity matters just as much as the headline itself.
Institutional Gold Price Forecasts for 2026 and 2027
Major institutions are unusually divided on gold, which makes comparison more valuable than relying on a single target. The table below summarizes several widely cited 2026 and 2027 views available by September 2026.
| Institution | 2026 View | 2027 View | Main Message |
| J.P. Morgan Global Research | Q4 2026 around $6,000 | Around $6,300 by late 2027 | Structural demand remains bullish, but the path depends heavily on Fed policy and geopolitical outcomes |
| HSBC | 2026 average $4,560 and year-end near $4,750 | 2027 average $4,925 and year-end near $5,025 | Higher rates and a stronger dollar cap upside, while fiscal and structural risks support prices |
| UBS | Medium-term path toward $5,000 | $5,000 possible in the first half of 2027 | Near-term volatility remains a risk, but the medium-term outlook is constructive |
| World Gold Council | Roughly ±5% around $4,100 under unchanged conditions | Scenario based rather than a single target | A clear catalyst is needed for a sustained move toward $4,500 or $5,000 |
| Reuters analyst poll | Median 2026 forecast about $4,509 | Not a single house target | Forecasts were revised lower as rates and the dollar became more challenging |
How High Can Gold Go in 2026?
Gold can still move materially above current levels, but a move toward $5,000 or $6,000 would require stronger catalysts than simple continuation of the existing trend. The World Gold Council’s scenario analysis suggested that gold could resume an advance toward roughly $4,500 if economic or geopolitical conditions deteriorated, rate expectations reversed, or long-term investor participation increased.
It argued that a sustainable move toward $5,000 would probably need a clearer and stronger signal. J.P. Morgan’s forecast is more aggressive, with a $6,000 fourth-quarter target, but even that outlook is increasingly conditional on rates.
The bullish case becomes stronger when several signals appear together.
- US real yields begin falling even if nominal inflation remains elevated.
- The Federal Reserve turns less hawkish or markets begin pricing future easing again.
- The dollar weakens against major currencies, improving gold affordability outside the United States.
- ETF inflows and institutional allocations strengthen after the recent period of hesitation.
- Central bank demand remains persistent and reserve diversification continues.
- Geopolitical or fiscal risks intensify without creating a stronger-dollar rate shock that overwhelms safe-haven demand.
What Could Push Gold Lower?
The main bearish risk is a macro environment in which US growth stays resilient, inflation remains too high, and the Federal Reserve responds with a sustained tightening cycle. J.P. Morgan has highlighted that combination as a significant threat because it could weaken Western investment demand and increase ETF outflows. HSBC’s lower forecast also reflects a more hawkish Fed and a stronger dollar. In that environment, gold would be competing against high-yielding bonds and cash while the currency used to price it becomes more expensive.
The bearish case would become more convincing if several conditions develop together.
- Real Treasury yields remain elevated or move higher for a sustained period.
- The US dollar strengthens while inflation expectations remain contained.
- Gold repeatedly fails to hold rebounds above the $4,500 area.
- ETF holdings decline and institutional flows become persistently negative.
- Central bank purchases slow more than expected or official-sector selling increases.
- Jewellery and physical demand weaken further because high prices reduce affordability.
Gold Price Scenarios Through Early 2027
Because the forecast range is unusually wide, a scenario table is more useful than presenting one number as inevitable. These zones combine current price action with institutional forecasts and should be treated as planning ranges rather than guaranteed targets.
| Scenario | Indicative Price Zone | What Could Drive It | What Would Weaken the Scenario |
| Bullish | $4,800 to $6,000 | Falling real yields, weaker dollar, stronger ETF flows, central bank demand, worsening fiscal or geopolitical risk | Aggressive Fed tightening, stronger dollar, sustained ETF outflows |
| Base Case | $4,100 to $4,800 | Range trading, mixed rate signals, continuing strategic demand, periodic geopolitical support | A clear break in monetary policy or global risk conditions |
| Bearish | $3,800 to $4,100 | Higher real yields, stronger dollar, weaker investment demand, physical demand destruction | Falling yields, renewed safe-haven flows, strong official-sector buying |
Gold Price Forecast Chart and Key Technical Levels
The technical picture currently supports the idea of consolidation rather than a clean trend. Reuters reported that buyers reappeared as gold approached the $4,300 area in September, helping prices recover after a sharp decline. That makes the low-$4,300 region an important short-term reference zone. Around $4,500, the market faces a more meaningful test because that level sits above the recent consolidation area and is close to the upside zone identified in the World Gold Council’s scenario framework.
A sustained break above $4,500 would not automatically confirm a move to $5,000, but it would show that buyers are absorbing the pressure from higher yields. A decisive loss of $4,300 would weaken the short-term structure and increase the risk of a deeper move toward the lower end of institutional ranges. Technical levels should never be treated as permanent because gold can move rapidly after inflation data, central bank decisions, geopolitical events, or large changes in ETF flows.
Traders using XAU/USD charts should combine price levels with momentum and trend tools rather than depending on one indicator.
- Use moving averages to identify whether the broader trend is rising, falling, or flattening.
- Use RSI as a momentum measure rather than as an automatic buy or sell signal.
- Use MACD to evaluate whether trend momentum is strengthening or weakening.
- Mark recent swing highs and lows before applying Fibonacci retracement levels.
- Confirm breakouts with changes in yields, the dollar, volume, or market positioning when possible.
Short-Term Gold Price Prediction for the Next Three to Six Months
Over the next three to six months, gold is likely to remain highly sensitive to every change in the Federal Reserve outlook. The current price near the mid-$4,300s sits between a well-observed support area around $4,300 and a more difficult upside zone around $4,500. That setup favors volatility and range trading unless a new catalyst forces a breakout. A less hawkish Fed, lower real yields, or renewed geopolitical escalation could reopen the path toward $4,500 and then $5,000. A stronger tightening cycle could instead push gold toward $4,100 or below.
The practical short-term forecast is therefore conditional. Gold does not need to collapse simply because the Fed hikes once, and it does not need to rally simply because geopolitical risks remain high. What matters is whether investors believe inflation and rates will stay elevated after the immediate shock. The next major direction is more likely to emerge when monetary policy, the dollar, and institutional flows begin pointing in the same direction rather than sending conflicting signals.
Long-Term Gold Price Outlook for 2027 and Beyond
The long-term gold outlook remains constructive, but forecasts become less reliable as the time horizon expands. UBS sees a path toward $5,000 in the first half of 2027, while J.P. Morgan’s June forecast showed quarterly prices around $6,200 to $6,300 during 2027. HSBC is more conservative, expecting a 2027 average near $4,925 and a year-end level around $5,025. These differences show why long-term investors should focus on structural drivers rather than one target.
The strongest long-term supports are persistent government debt, concerns about currency purchasing power, reserve diversification, and the possibility that investors allocate a larger share of portfolios to real assets. The main long-term threats are sustained high real yields, stronger fiscal credibility, lower geopolitical risk, and weaker official-sector demand. Gold can remain strategically valuable even if prices spend long periods consolidating. A long-term thesis should therefore be reviewed against the reasons investors hold gold, not only against whether the price reaches a specific target in a specific year.
Economic Data to Watch Before Changing the Forecast
A gold forecast should be updated whenever the economic regime changes. The following indicators deserve the most attention because they can alter rate expectations, the dollar, and investor demand quickly.
- Federal Reserve decisions and guidance, especially any change in the expected path of policy rates.
- CPI and PCE inflation, including evidence that energy inflation is spreading into core prices.
- US payrolls, unemployment, wages, and consumer spending as measures of economic resilience.
- Two-year and ten-year Treasury yields, together with market-based measures of real yields.
- The US Dollar Index and major currency pairs, particularly during large changes in rate differentials.
- ETF holdings, central bank demand, and major positioning changes that reveal whether investment demand is strengthening or weakening.
Risks to the Gold Price Forecast
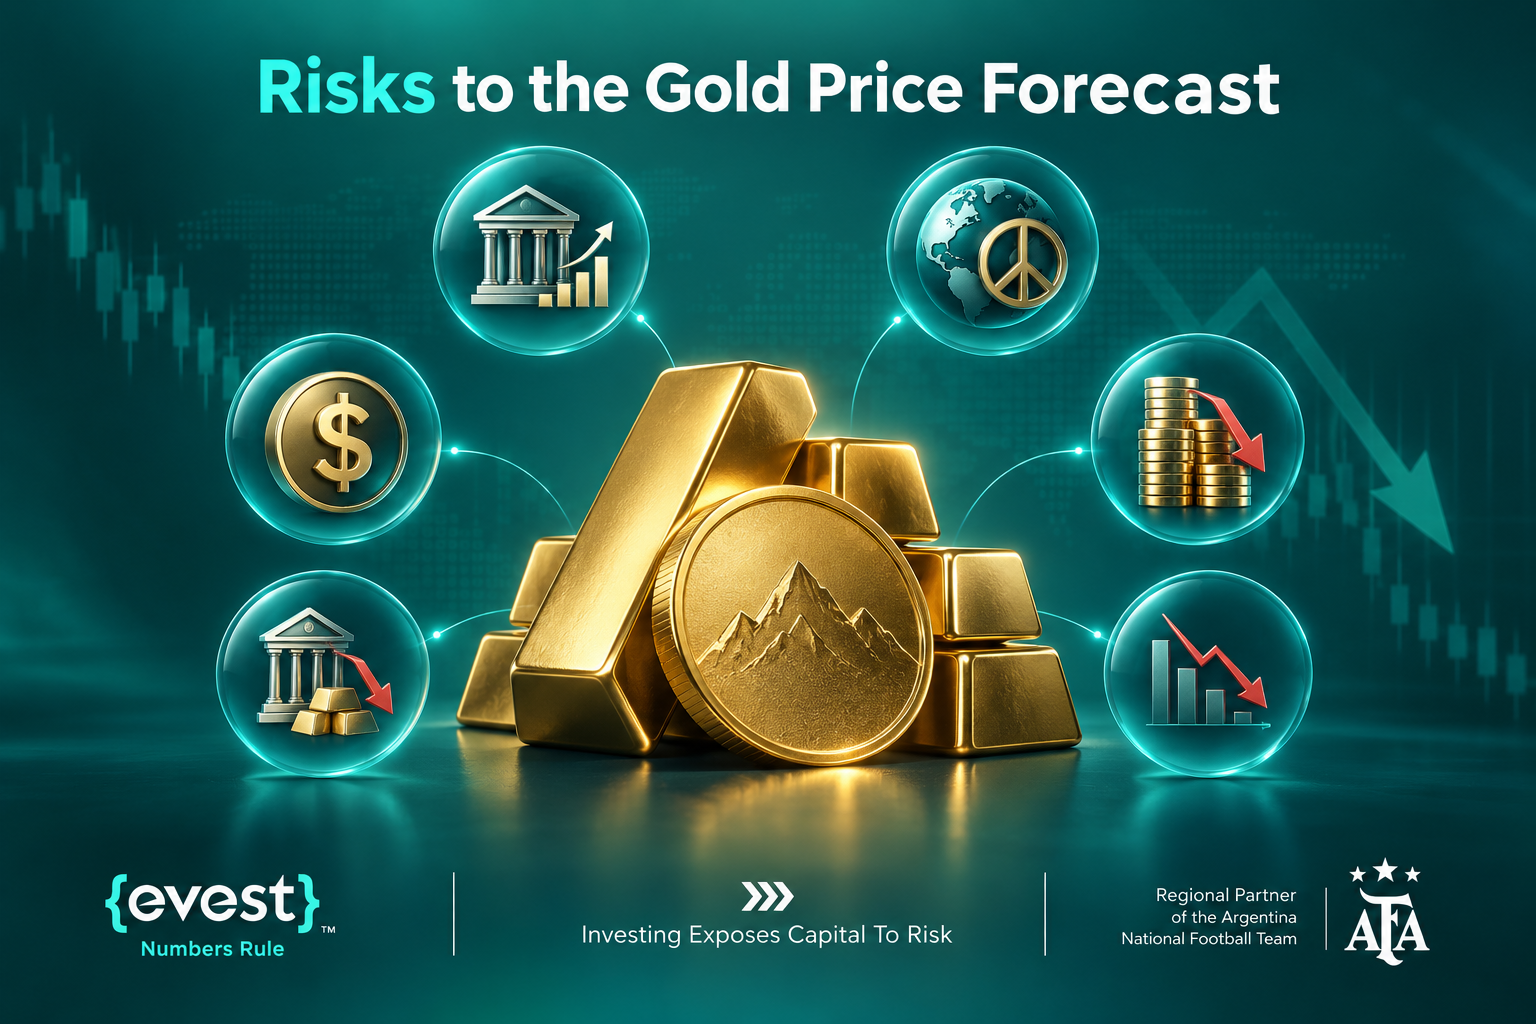
No gold forecast is reliable without identifying the events that could invalidate it. The largest risks are not limited to price volatility. They are changes in the macro relationships that investors currently use to value the metal.
- A stronger and longer Federal Reserve tightening cycle could raise real yields and reduce demand for non-yielding gold.
- A rapid easing of geopolitical tensions could remove part of the safe-haven premium embedded in current prices.
- A stronger US dollar could make bullion more expensive for international buyers and pressure investment flows.
- Persistent ETF outflows could turn a normal correction into a deeper decline if institutional demand weakens simultaneously.
- Lower central bank demand or unexpected official-sector selling could reduce one of the market’s strongest structural supports.
- A recession or liquidity shock could create two-way volatility because investors may initially sell gold for cash before safe-haven demand returns.
These risks mean the forecast should be read as a framework based on conditions available in September 2026. If inflation, Fed policy, geopolitical conditions, or investment flows change materially, the price zones and scenarios in this article should be refreshed rather than treated as permanent targets.
Gold Price Forecast 2026 Final Outlook
Gold remains supported by powerful long-term themes, but the rest of 2026 is unlikely to be a simple continuation of the rally that defined earlier phases of the cycle. Near $4,363 per ounce, the market is balancing strategic demand against higher rates and a stronger policy response to inflation. The $4,300 area is an important short-term reference, while a sustained move above $4,500 would improve the bullish structure and bring higher institutional targets back into focus.
The most reasonable base case is continued volatility inside a broad range, with upside toward $4,800 or beyond if real yields fall and investment demand strengthens. More aggressive forecasts toward $5,000 to $6,000 require stronger catalysts and should not be treated as guaranteed outcomes. On the downside, persistent Fed tightening, a stronger dollar, and weaker institutional demand could pull prices toward $4,100 or the lower end of the 2026 forecast ranges. The strongest strategy is to monitor the drivers behind the price instead of relying on one prediction.
FAQs
What is the gold price forecast for the end of 2026?
Gold forecasts vary widely. HSBC sees year-end 2026 near $4,750, while J.P. Morgan projects about $6,000 in Q4. The World Gold Council presents lower scenario ranges. Actual prices will depend on rates, yields, demand, and geopolitical risk.
How high can gold go in 2026?
Gold could move toward $4,500 or $5,000 if yields fall, the dollar weakens, and safe-haven demand strengthens. J.P. Morgan has a more bullish $6,000 fourth-quarter forecast, but that outcome is dependent on monetary and geopolitical conditions.
What could make gold prices fall?
Gold could fall if the Federal Reserve keeps tightening, real Treasury yields stay high, the US dollar strengthens, ETF outflows continue, or central bank demand weakens. Lower geopolitical risk could also reduce safe-haven demand and pressure prices from elevated levels.
Is gold still a good hedge against inflation?
Gold can help diversify exposure to inflation and currency risk, but its relationship with inflation is not automatic. If inflation causes aggressive rate increases and higher real yields, gold may fall. It works best as part of a risk framework.
What is the gold price outlook for 2027?
Major forecasts remain constructive but differ substantially. UBS sees gold reaching $5,000 in the first half of 2027, J.P. Morgan projects roughly $6,200 to $6,300 then, while HSBC expects a more moderate path near $5,000.